9. Assume that the content of 15-litres container is normally distributed. To test Ho: u = 15.2 against H : u> 15.2, we take a random sample of sizen = 25 and observe that = 15.6 litres and s = 0.5 litre. (Use 0.01 level of significance) a) Perform the testing by using test statistic. b) Perform the testing by using p-value test.
9. Assume that the content of 15-litres container is normally distributed. To test Ho: u = 15.2 against H : u> 15.2, we take a random sample of sizen = 25 and observe that = 15.6 litres and s = 0.5 litre. (Use 0.01 level of significance) a) Perform the testing by using test statistic. b) Perform the testing by using p-value test.

MATLAB: An Introduction with Applications
6th Edition
ISBN:9781119256830
Author:Amos Gilat
Publisher:Amos Gilat
Chapter1: Starting With Matlab
Section: Chapter Questions
Problem 1P

Related questions
Question
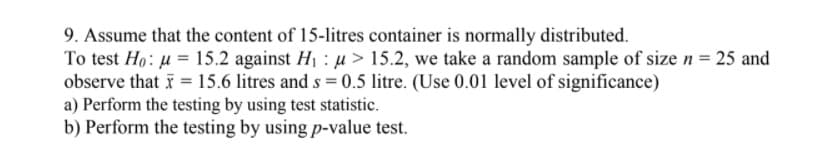
Transcribed Image Text:9. Assume that the content of 15-litres container is normally distributed.
To test Ho: u = 15.2 against H1 : u > 15.2, we take a random sample of size n = 25 and
observe that i = 15.6 litres and s = 0.5 litre. (Use 0.01 level of significance)
a) Perform the testing by using test statistic.
b) Perform the testing by using p-value test.
Expert Solution
This question has been solved!
Explore an expertly crafted, step-by-step solution for a thorough understanding of key concepts.

Step by step
Solved in 3 steps

Recommended textbooks for you
MATLAB: An Introduction with Applications
Statistics
ISBN:
9781119256830
Author:
Amos Gilat
Publisher:
John Wiley & Sons Inc

Probability and Statistics for Engineering and th…
Statistics
ISBN:
9781305251809
Author:
Jay L. Devore
Publisher:
Cengage Learning

Statistics for The Behavioral Sciences (MindTap C…
Statistics
ISBN:
9781305504912
Author:
Frederick J Gravetter, Larry B. Wallnau
Publisher:
Cengage Learning
MATLAB: An Introduction with Applications
Statistics
ISBN:
9781119256830
Author:
Amos Gilat
Publisher:
John Wiley & Sons Inc
Probability and Statistics for Engineering and th…
Statistics
ISBN:
9781305251809
Author:
Jay L. Devore
Publisher:
Cengage Learning
Statistics for The Behavioral Sciences (MindTap C…
Statistics
ISBN:
9781305504912
Author:
Frederick J Gravetter, Larry B. Wallnau
Publisher:
Cengage Learning

Elementary Statistics: Picturing the World (7th E…
Statistics
ISBN:
9780134683416
Author:
Ron Larson, Betsy Farber
Publisher:
PEARSON

The Basic Practice of Statistics
Statistics
ISBN:
9781319042578
Author:
David S. Moore, William I. Notz, Michael A. Fligner
Publisher:
W. H. Freeman

Introduction to the Practice of Statistics
Statistics
ISBN:
9781319013387
Author:
David S. Moore, George P. McCabe, Bruce A. Craig
Publisher:
W. H. Freeman