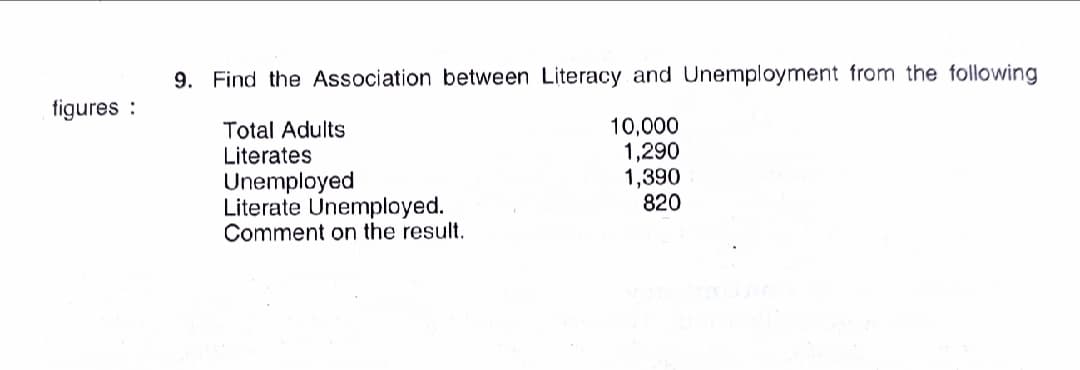
9. Find the Association between Literacy and Unemployment from the following figures : Total Adults Literates Unemployed Literate Unemployed. Comment on the result. 10,000 1,290 1,390 820


Q: Married Unmarried Passed 90 260 Failed 65 110 Total 155 370 Calculate Yule's Coefficient of…
A: Given that 2×2 contingency table Passed Failed Total Married 90 65 155 Unmarried 260…
Q: 16. (a) List the five main headings under which information collected under health statistics are…
A: Since you have posted multiple questions, I'll answer the first one as per our policy. The question…
Q: The United States has an aging infrastructure as witnessed by several recent disasters, in the I-35…
A: First Quartile: Q1=4.57, from the excel function, =QUARTILE(E2:E31,1) Q3=6.125, from the excel…
Q: 6.2.6 In a survey of introductory statistics students, an in- structor asked her students to report…
A: We have to answer the question based on number of facebook friends and sex of person
Q: Find out by interpolation from the following data the number of workers earning $ 24 of more but…
A: Given: Earning less than ($) Number of workers 20 296 25 599 30 804 35 918 40 966
Q: The following data show defective articles produced by 4 machines: Machine: Production time: A В 1 1…
A:
Q: According to the following the federal excise tax on both tobacco and alcohol accounts for of total…
A: Solution: The given bar charts represents the total federal excise tax % of total funds raised.…
Q: Number of drivers involved with accidents during night time. Number of drivers involved with…
A:
Q: 6. Represent the following data by a simple bar diagram. Production of sugar (quintals' 0000)…
A: We have given that the data of production of sugar and Countries.
Q: In Fall 2020, 10.5 million undergraduate students attended a 4-year institution full- time. Of…
A: Given that, in Fall 2020, 10.5 million undergraduate students attended a 4-year institution…
Q: The following is educat ege's president in 2012. Serving Majority of Minorities in Higher Educati…
A: A coordinate grid has two perpendicular lines, or axes, labelled like number lines. The horizontal…
Q: 2. Using the measure of dispersion, describe the population of the world's top ten (10) crowded…
A: The data set has been given as: Population 37393128 30290936 27058480 22043028…
Q: 3.7 The article "Housework around the World" (USA Today, September 15, 2009) included the percentage…
A: (a) Enter the data into the excel sheet as follows: Select Insert> charts>All charts…
Q: You work for an insurance company and are studying the relationship between types of crashes and the…
A:
Q: „45. The following summary data relate to the adult population of a small village: Adult population…
A:
Q: 14. Calculate S.D. from the following data. Values : 110, 115, 120, 125, 130, 135, 140, 145, 150,…
A:
Q: In one region it was found that 28% of people with incomes less than $50,000 use the Internet; 48%…
A: Given: Income Internet use Do not use internet <50000 0.28 0.72 50000-74999 0.48 0.52…
Q: The authors of a paper concerned about racial stereotypes in television counted the number of times…
A: We have to test that if proportions are changed since last census for that we will use goodness of…
Q: 12 13 14 15 16 17 18 data Based on the boxplot above, identify the 5 number summary
A:
Q: 35. By using a suitable interpolation formula, estimate the price for the year 1997 using the…
A:
Q: 1. The following table is the result of a survey regarding age group and whether or not a person has…
A:
Q: 2- The range for the following data: 70,40,6,50,13,8,90,30 is equal to
A: The given data: 70, 40, 6, 50, 13, 8, 90, 30 Formula used: The range of the data is Range=Xm-Xo…
Q: Refer to the following: For countries listed in the Human Development Report, the correlation…
A: Given information- Correlation between the percent of people using the Internet and per capita gross…
Q: A study was made in T.I.P. Quezon City which will determine the relationship between the sales and…
A: Given: Sales Costs 368 1.7 340 1.5 665 2.8 954 5 331 1.3 556 2.2 376 1.3…
Q: 1. The following data represent the estimated number (in millions) of computers connected to the…
A: Use the Excel and Draw the Horizontal bar graph Followings are the Steps to draw the bar graph 1)…
Q: A mining company finds that daily lost-work injuries averages to 1.2. If the local union contract…
A:
Q: City planners believe that larger cities are populated by older residents. To investigate the…
A: Enter the given data into the excel as follows:
Q: write down the eight famous steps that are used to conduct correlation to examine if there is any…
A: From the given Data : Let Population represented by X : X Values Government expenditure represented…
Q: Which age groups are being compared for contrast 1? 30 to 39 year olds and 40 to 49 year olds 40 to…
A: The t-test output with ANOVA and descriptive for the 4 age groups are given.
Q: What is the proportion of single women among those who are 30-44 years old? Of the total…
A: It is given that Total number of women = 272 Number of single women = 91 Number of women who are…
Q: The table shows data about student involvement in extracurricular activities at a local high school.…
A:
Q: The data below presents repre data from the National Center for Health Statistics in the US for the…
A:
Q: From the following table, estimate the number of students who ob- tained marks between 40 and 45:…
A: We Solve the given problem using Newton's forward interpolation method.
Q: 11. From the following data estimate the number of students getting marks etween 20 and 25. Marks…
A: Given : Marks below 10 below 20 below 30 below 40 below 50 Number of student 20 45 115 210 325
Q: The data below shows the number of accidents in (200) Cities Vehicles Accidents Number of Cities…
A: Given data is appropriate for measures of central tendency to find a mean.
Q: The following table is the result of a survey regarding age group and whether or not a person has…
A: (a) Obtain the percentage of people were young. The percentage of people were young is obtained…
Q: With a view to study whether the working condition in a factory had any influence on the frequency…
A: The objective is to calculate COEFFICIENT OF ASSOCIATION of given data.
Q: Agreed to participate Did not agree to Participate Total Contacted 20 15 35 African American 12 15…
A: a.The percentage of women overall were as follows: Total contacted Percentage African…
Q: The following contingency table is on Autism and Breastfeeding: Autism None Less than 2 months 2 to…
A: Given data: Autism None Less than 2 months 2 to 6 months More than 6 months Total Yes 241 198…
Q: 3. The following data gives the information on the ages (in years) and the number of breakdowns…
A:
Q: 7. Give 5 types of information collected by surveillance system. TABLE 1 Original Enrolment Dead at…
A: There are 3141 nondiabetic men and 185 diabetic men. So the ratio is 3141: 185 Answer(A): 3141 :…
Q: Find the Association between Literacy and Unemployment from the following Total Adults 10,000…
A: The association between the binary variables are calculated using the Yule's coefficient of…
Q: City planners believe that lorger cities are populated by older residents. To investigate the…
A: Disclaimer : “Since you have posted a question with multiple sub-parts, we will solve first three…
Q: 34. Compute median from the following data: Income (in ): Number of persons: 2 4 10 40 20 30 15 10 4…
A:
Q: Consider the following data regarding the average spending on health care person for various…
A: Hai
Q: 2. Using the measures of dispersion, describe the population of the world's top ten (10) crowded…
A: Measures of dispersion indicate how far the data values lie away from the mean. The three most…
Q: The following table shows some data from a study on substance use among 10th graders in the United…
A: From the table: x + y = 14,400...................................................................(i)…
Q: Estimate the Number of Students who get more than 48 but not more than 50 Marks from the following…
A:
Q: City Population City (in millions) Median age Chicago, IL 2.833 31.5 Dallas, TX 1.233 30.5 Houston,…
A:
Q: 9- we know the population mean for turnover intentions is μ = 2.00. Is the mean for our current…
A: Given : μ = 2.00 α = 0.01 Hypothesis : H0 : μ = 2 Ha : μ ≠ 2 x¯ = ∑xin x¯ = 3+4+....+2+320 x¯ = 5320…

Step by step
Solved in 3 steps with 3 images

- suppose that from a sample of 200,000 new york workers, 32,400 reported traveling more than an hour an day. From this information, statisticians determined that about 16.2% of the workers in the state traveled more than an hou to work every day in 2011. If there were 8,437,512 workers in the entire population, about how many traveled more than an hour to work each day?4. The number of passengers (in thousands) for the leading U.S. passenger airlines in 2004 is indicated below. 91,570 86,755 81,066 70,786 55,373 42,400 40,551 21,119 16,280 14,869 13,659 13,417 13,170 12,632 11,731 10,420 10,024 9,122 7,041 6,954 6,406 6,362 5,930 5,585 5,427• Use the data to construct a grouped frequency distribution and a cumulative frequency distribution with a reasonable number of classes and comment on the shape of the distribution using graph.72% of Americans said that they plan to travel in 2021, and 9% of those who plan to travelintend to take an international trip. What percentage of Americans plan to take aninternational trip in 2021?
- Kentville, a community of 10,000 people, resides next to a krypton mine, and there is a concern that the emission from the krypton smelter have resulted in adverse effects. Specifically, Kryptonosis seems to have killed 12 of Kentville’s inhabitants last year. A neighboring community, Lanesburg, has 25,000 inhabitants and is far enough from the smelter to not be affected by the emission. In Lanesburg, only three people last year died of Kryptonosis. Given that the number of deaths in Kentville and their causes last year were: Heart attack=7 Accidents=4 Kryptonosis=12 Other=6 What is the risk of dying of Kryptonosis in Kentville relative to non-contaminated locality?What is the risk of dying of Kryptonosis in Kentville relative to deaths due to other causes? How many times the chance of dying of Kryptonosis compared to dying of accidents ? How many times the chance of dying of Kryptonosis compared to Other causes?In a poll of 531 human resource professionals, 53.9% said that body piercings and tattoos were big grooming red flags. Complete parts (a) through (d) below. a) Among the 531 human resource professionals who were surveyed, how many of them said that body piercings and tattoos were big grooming red flags?Suppose we want to estimate the annual high temperatures of the hottest major cities in the United States. Below is data from 12 cities with the average annual temperature taken from 1971 to 2000 City Temperature (Fahrenheit) Phoenix, Arizona 87.2 Miami, Florida 84.3 Orlando, Florida 82.8 Riverside, California 80.9 Austin, Texas 79.8 Houston, Texas 79.7 San Antonio, Texas 80.3 Las Vegas, Nevada 80.1 Jacksonville, Florida 79.3 New Orleans, Louisiana 78.2 Tampa, Florida 81.7 Los Angeles, California 75.2 What's the population for this study? What's the sample for this study?
- The National Center for Health Statistics, housed within the U.S. Centers for Disease Control and Prevention (CDC), tracks the number of adults in the United States who have health insurance. According to this agency, the uninsured rates for Americans in 2018 are as follows: 5.1% of those under the age of 18, 12.4% of those ages 18-64, and 1.1% of those 65and older do not have health insurance (CDC website). Approximately 22.8% of Americans are under age 18, and 61.4% of Americans are aged 18-64. Given that the person is an uninsured American, what is the probability that the person is 65 or older (to 3 decimals)?Develop two research hypotheses: (a) one that would be used to examine differences between two unrelated groups and (b) one that would examine differences between two dependent groups.The average time that Italy commute to work is 23.15 minutes (Best 4 Tourist Places, June 15, 2020). The average commute times in minutes for 18 cities are given in Table 3.1. Table 3.1 City Time (minutes) Rome 24.9 Milan 26.8 Naples 26.2 Turin 28.1 Palermo 31.7 Genoa 25.8 Bologna 23.3 Florence 32.1 Bari 28.5 Catania 24.4 Verona 29.3 Venice 24.8 Messina 38.1 Padua 28.3 Trieste 28.4 Taranto 24.6 Prato 20.1 Modena 23.4 1) What is the mode for these 18 cities? 2) Find 28th and 77th Percentile of commute times for these 18 cities.
- The average time that Italy commute to work is 23.15 minutes (Best 4 Tourist Places, June 15, 2020). The average commute times in minutes for 18 cities are given in Table 3.1. Table 3.1 City Time (minutes) Rome 24.9 Milan 26.8 Naples 26.2 Turin 28.1 Palermo 31.7 Genoa 25.8 Bologna 23.3 Florence 32.1 Bari 28.5 Catania 24.4 Verona 29.3 Venice 24.8 Messina 38.1 Padua 28.3 Trieste 28.4 Taranto 24.6 Prato 20.1 Modena 23.4 a) What is the mean commute time for these 18 cities? b) What is the median commute time for these 18 cities? c) What is the mode for these 18 cities? d) What is the variance and standard deviation of commute times for these 18 cities? e) Find the z – score value of commute time for these 18 cities. f) Find 28th and 77th Percentile of commute times for these 18 cities.The average time that Italy commute to work is 23.15 minutes (Best 4 Tourist Places, June 15, 2020). The average commute times in minutes for 18 cities are given in Table 3.1. Table 3.1 City Time (minutes) Rome 24.9 Milan 26.8 Naples 26.2 Turin 28.1 Palermo 31.7 Genoa 25.8 Bologna 23.3 Florence 32.1 Bari 28.5 Catania 24.4 Verona 29.3 Venice 24.8 Messina 38.1 Padua 28.3 Trieste 28.4 Taranto 24.6 Prato 20.1 Modena 23.4 d) What is the variance and standard deviation of commute times for these 18 cities? e) Find the z – score value of commute time for these 18 cities. f) Find 28th and 77th Percentile of commute times for these 18 cities.The average time that Italy commute to work is 23.15 minutes (Best 4 Tourist Places, June 15, 2020). The average commute times in minutes for 18 cities are given in Table 3.1. Table 3.1 City Time (minutes) Rome 24.9 Milan 26.8 Naples 26.2 Turin 28.1 Palermo 31.7 Genoa 25.8 Bologna 23.3 Florence 32.1 Bari 28.5 Catania 24.4 Verona 29.3 Venice 24.8 Messina 38.1 Padua 28.3 Trieste 28.4 Taranto 24.6 Prato 20.1 Modena 23.4 a) What is the mean commute time for these 18 cities? b) What is the median commute time for these 18 cities? c) What is the mode for these 18 cities? d) What is the variance and standard deviation of commute times for these 18 cities? f) Find 28th and 77th Percentile of commute times for these 18 cities.


