9. If the coefficient of correlation between two variables x and y is 0.5 and the acute angle between their lines of regression is tan-1, show that ox Oy 2+V3
9. If the coefficient of correlation between two variables x and y is 0.5 and the acute angle between their lines of regression is tan-1, show that ox Oy 2+V3

Functions and Change: A Modeling Approach to College Algebra (MindTap Course List)
6th Edition
ISBN:9781337111348
Author:Bruce Crauder, Benny Evans, Alan Noell
Publisher:Bruce Crauder, Benny Evans, Alan Noell
Chapter5: A Survey Of Other Common Functions
Section5.6: Higher-degree Polynomials And Rational Functions
Problem 1TU: The following fictitious table shows kryptonite price, in dollar per gram, t years after 2006. t=...

Related questions
Question
Please answer number 9 with complete solution
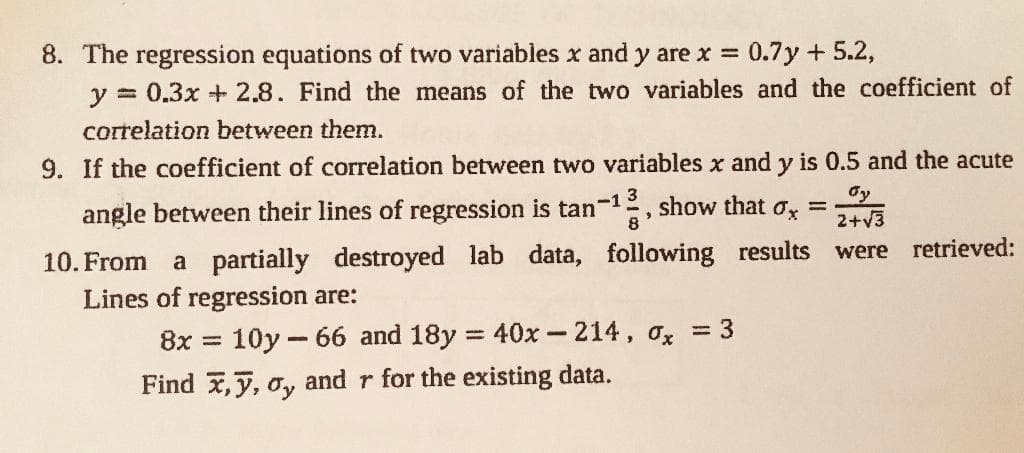
Transcribed Image Text:8. The regression equations of two variables x and y are x =
y = 0.3x +2.8. Find the means of the two variables and the coefficient of
0.7y + 5.2,
correlation between them.
9. If the coefficient of correlation between two variables x and y is 0.5 and the acute
angle between their lines of regression is tan-1
3
2, show that ox =
8
dy
2+v3
lab data, following results
retrieved:
were
10. From
a partially destroyed
Lines of regression are:
8x =
10y - 66 and 18y = 40x-214, ox = 3
%3D
Find x,y, o, and r for the existing data.
Expert Solution
This question has been solved!
Explore an expertly crafted, step-by-step solution for a thorough understanding of key concepts.

Step by step
Solved in 2 steps with 2 images

Recommended textbooks for you
Functions and Change: A Modeling Approach to Coll…
Algebra
ISBN:
9781337111348
Author:
Bruce Crauder, Benny Evans, Alan Noell
Publisher:
Cengage Learning

Algebra & Trigonometry with Analytic Geometry
Algebra
ISBN:
9781133382119
Author:
Swokowski
Publisher:
Cengage

College Algebra
Algebra
ISBN:
9781305115545
Author:
James Stewart, Lothar Redlin, Saleem Watson
Publisher:
Cengage Learning
Functions and Change: A Modeling Approach to Coll…
Algebra
ISBN:
9781337111348
Author:
Bruce Crauder, Benny Evans, Alan Noell
Publisher:
Cengage Learning
Algebra & Trigonometry with Analytic Geometry
Algebra
ISBN:
9781133382119
Author:
Swokowski
Publisher:
Cengage
College Algebra
Algebra
ISBN:
9781305115545
Author:
James Stewart, Lothar Redlin, Saleem Watson
Publisher:
Cengage Learning