9. Relationship between tax revenues, deadweight loss, and demandelasticity The government is considering levying a tax of $60 per unit on suppliers of either concert tickets or bus passes. The supply curve for each of these two goods is identical, as you can see on each of the following graphs. The demand for concert tickets is shown by Dc (on the first graph), and the demand for bus passes is shown by DB (on the second graph). Suppose the government taxes concert tickets. The following graph shows the annual supply and demand for this good. It also shows the supply curve (S+ Taz) shifted up by the amount of the proposed tax ($60 per ticket). On the following graph, use the green rectangle (triangle symbols) to shade the area that represents tax revenue for concert tickets. Then use the black triangle (plus symbols) to shade the area that represents the deadweight loss associated with the tax. Concert Tickets Market 120 110 S-Tax Supply 100 Tax Revenue 90 80 Desdveight Loss 70 60 50 40 30 20 10 50 100 150 200 250 300 3s0 400 450 500 s00 600 QUANTITY (Tickets) Instead, suppose the govermment taxes bus passes. The following graph shows the annual supply and demand for this good, as wwell as the supply curve shifted up by the amount of the proposed tax (S60 per pass). PRICE (Dollars per ticket)
9. Relationship between tax revenues, deadweight loss, and demandelasticity The government is considering levying a tax of $60 per unit on suppliers of either concert tickets or bus passes. The supply curve for each of these two goods is identical, as you can see on each of the following graphs. The demand for concert tickets is shown by Dc (on the first graph), and the demand for bus passes is shown by DB (on the second graph). Suppose the government taxes concert tickets. The following graph shows the annual supply and demand for this good. It also shows the supply curve (S+ Taz) shifted up by the amount of the proposed tax ($60 per ticket). On the following graph, use the green rectangle (triangle symbols) to shade the area that represents tax revenue for concert tickets. Then use the black triangle (plus symbols) to shade the area that represents the deadweight loss associated with the tax. Concert Tickets Market 120 110 S-Tax Supply 100 Tax Revenue 90 80 Desdveight Loss 70 60 50 40 30 20 10 50 100 150 200 250 300 3s0 400 450 500 s00 600 QUANTITY (Tickets) Instead, suppose the govermment taxes bus passes. The following graph shows the annual supply and demand for this good, as wwell as the supply curve shifted up by the amount of the proposed tax (S60 per pass). PRICE (Dollars per ticket)

Principles of Microeconomics
7th Edition
ISBN:9781305156050
Author:N. Gregory Mankiw
Publisher:N. Gregory Mankiw
Chapter6: Supply, Demand And Government Policies
Section: Chapter Questions
Problem 4PA

Related questions
Question
i need help , i keep getting it woring and this is my last chance
macroeconmics question 9
Transcribed Image Text:9. Relationship between tax revenues, deadweight loss, and demandelasticity
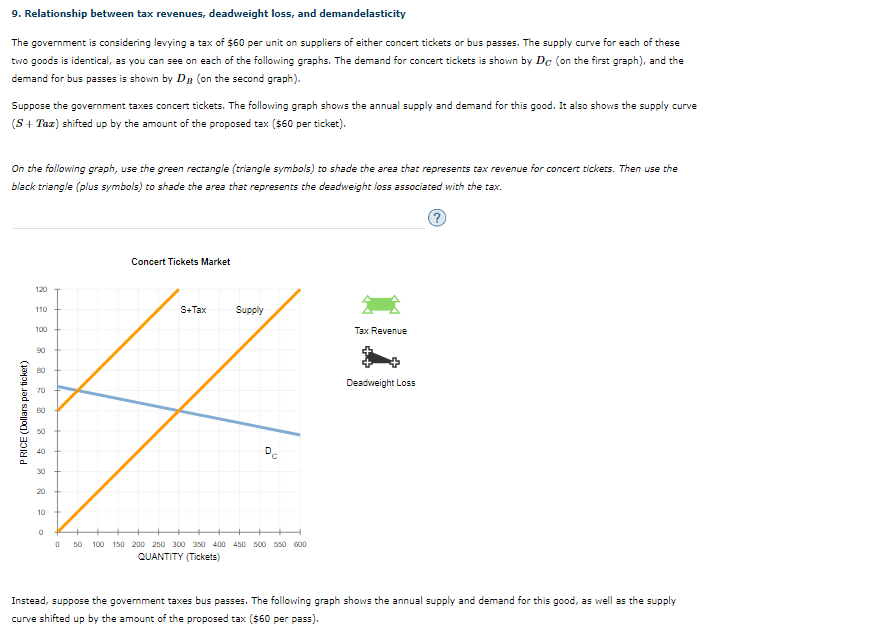
The government is considering levying a tax of $60 per unit on suppliers of either concert tickets or bus passes. The supply curve for each of these
two goods is identical, as you can see on each of the following graphs. The demand for concert tickets is shown by Dc (on the first graph), and the
demand for bus passes is shown by DB (on the second graph).
Suppose the government taxes concert tickets. The following graph shows the annual supply and demand for this good. It also shows the supply curve
(S+ Taz) shifted up by the amount of the proposed tax ($60 per ticket).
On the following graph, use the green rectangle (triangle symbols) to shade the area that represents tax revenue for concert tickets. Then use the
black triangle (plus symbols) to shade the area that represents the deadweight loss associated with the tax.
Concert Tickets Market
120
110
S-Tax
Supply
100
Tax Revenue
90
80
Desdveight Loss
70
60
50
40
30
20
10
50
100 150 200 250 300 3s0 400 450 500 s00 600
QUANTITY (Tickets)
Instead, suppose the govermment taxes bus passes. The following graph shows the annual supply and demand for this good, as wwell as the supply
curve shifted up by the amount of the proposed tax (S60 per pass).
PRICE (Dollars per ticket)
Expert Solution
This question has been solved!
Explore an expertly crafted, step-by-step solution for a thorough understanding of key concepts.

This is a popular solution!

Trending now
This is a popular solution!

Step by step
Solved in 2 steps with 1 images

Knowledge Booster


Learn more about
Need a deep-dive on the concept behind this application? Look no further. Learn more about this topic, economics and related others by exploring similar questions and additional content below.Recommended textbooks for you
Principles of Microeconomics
Economics
ISBN:
9781305156050
Author:
N. Gregory Mankiw
Publisher:
Cengage Learning

Principles of Macroeconomics (MindTap Course List)
Economics
ISBN:
9781305971509
Author:
N. Gregory Mankiw
Publisher:
Cengage Learning

Principles of Microeconomics (MindTap Course List)
Economics
ISBN:
9781305971493
Author:
N. Gregory Mankiw
Publisher:
Cengage Learning
Principles of Microeconomics
Economics
ISBN:
9781305156050
Author:
N. Gregory Mankiw
Publisher:
Cengage Learning
Principles of Macroeconomics (MindTap Course List)
Economics
ISBN:
9781305971509
Author:
N. Gregory Mankiw
Publisher:
Cengage Learning
Principles of Microeconomics (MindTap Course List)
Economics
ISBN:
9781305971493
Author:
N. Gregory Mankiw
Publisher:
Cengage Learning

Principles of Economics (MindTap Course List)
Economics
ISBN:
9781305585126
Author:
N. Gregory Mankiw
Publisher:
Cengage Learning

Essentials of Economics (MindTap Course List)
Economics
ISBN:
9781337091992
Author:
N. Gregory Mankiw
Publisher:
Cengage Learning

Principles of Macroeconomics (MindTap Course List)
Economics
ISBN:
9781285165912
Author:
N. Gregory Mankiw
Publisher:
Cengage Learning