The government is considering levying a tax of $60 per unit on suppliers of either concert tickets or bus passes. The supply curve for each of these two goods is identical, as you can see on each of the following graphs. The demand for concert tickets is shown by DCDC (on the first graph), and the demand for bus passes is shown by DBDB (on the second graph). Suppose the government taxes concert tickets. The following graph shows the annual supply and demand for this good. It also shows the supply curve (S+TaxS+Tax) shifted up by the amount of the proposed tax ($60 per ticket). On the following graph, use the green rectangle (triangle symbols) to shade the area that represents tax revenue for concert tickets. Then use the black triangle (plus symbols) to shade the area that represents the deadweight loss associated with the tax. Concert Tickets MarketTax RevenueDeadweight Loss0501001502002503003504004505005506001201101009080706050403020100PRICE (Dollars per ticket)QUANTITY (Tickets)DCSupplyS+Tax Instead, suppose the government taxes bus passes. The following graph shows the annual supply and demand for this good, as well as the supply curve shifted up by the amount of the proposed tax ($60 per pass). On the following graph, do the same thing that you did on the graph for concert tickets. Use the green rectangle (triangle symbols) to shade the area that represents tax revenue for bus passes. Then, use the black triangle (plus symbols) to shade the area that represents the deadweight loss associated with the tax. Bus Passes MarketTax RevenueDeadweight Loss0501001502002503003504004505005506001201101009080706050403020100PRICE (Dollars per pass)QUANTITY (Passes)DBSupplyS+Tax Complete the following table with the tax revenue collected and deadweight loss caused by each of the tax proposals. If the Government Taxes... Tax Revenue Deadweight Loss (Dollars) (Dollars) Concert tickets at $60 per ticket Bus passes at $60 per pass Suppose the government wants to tax the good that will generate more tax revenue at a lower welfare cost. In this case, it should tax because, all else held constant, taxing a good with a relatively elastic demand generates larger tax revenue and smaller deadweight loss.
The government is considering levying a tax of $60 per unit on suppliers of either concert tickets or bus passes. The supply curve for each of these two goods is identical, as you can see on each of the following graphs. The demand for concert tickets is shown by DCDC (on the first graph), and the demand for bus passes is shown by DBDB (on the second graph). Suppose the government taxes concert tickets. The following graph shows the annual supply and demand for this good. It also shows the supply curve (S+TaxS+Tax) shifted up by the amount of the proposed tax ($60 per ticket). On the following graph, use the green rectangle (triangle symbols) to shade the area that represents tax revenue for concert tickets. Then use the black triangle (plus symbols) to shade the area that represents the deadweight loss associated with the tax. Concert Tickets MarketTax RevenueDeadweight Loss0501001502002503003504004505005506001201101009080706050403020100PRICE (Dollars per ticket)QUANTITY (Tickets)DCSupplyS+Tax Instead, suppose the government taxes bus passes. The following graph shows the annual supply and demand for this good, as well as the supply curve shifted up by the amount of the proposed tax ($60 per pass). On the following graph, do the same thing that you did on the graph for concert tickets. Use the green rectangle (triangle symbols) to shade the area that represents tax revenue for bus passes. Then, use the black triangle (plus symbols) to shade the area that represents the deadweight loss associated with the tax. Bus Passes MarketTax RevenueDeadweight Loss0501001502002503003504004505005506001201101009080706050403020100PRICE (Dollars per pass)QUANTITY (Passes)DBSupplyS+Tax Complete the following table with the tax revenue collected and deadweight loss caused by each of the tax proposals. If the Government Taxes... Tax Revenue Deadweight Loss (Dollars) (Dollars) Concert tickets at $60 per ticket Bus passes at $60 per pass Suppose the government wants to tax the good that will generate more tax revenue at a lower welfare cost. In this case, it should tax because, all else held constant, taxing a good with a relatively elastic demand generates larger tax revenue and smaller deadweight loss.

Principles of Economics (MindTap Course List)
8th Edition
ISBN:9781305585126
Author:N. Gregory Mankiw
Publisher:N. Gregory Mankiw
Chapter12: The Design Of The Tax System
Section: Chapter Questions
Problem 4CQQ

Related questions
Question
3. Relationship between tax revenues, deadweight loss , and demandelasticity
the person who solved the previous time was wrong please help me with the right explanation and solution
The government is considering levying a tax of $60 per unit on suppliers of either concert tickets or bus passes. The supply curve for each of these two goods is identical, as you can see on each of the following graphs. The demand for concert tickets is shown by DCDC (on the first graph), and the demand for bus passes is shown by DBDB (on the second graph).
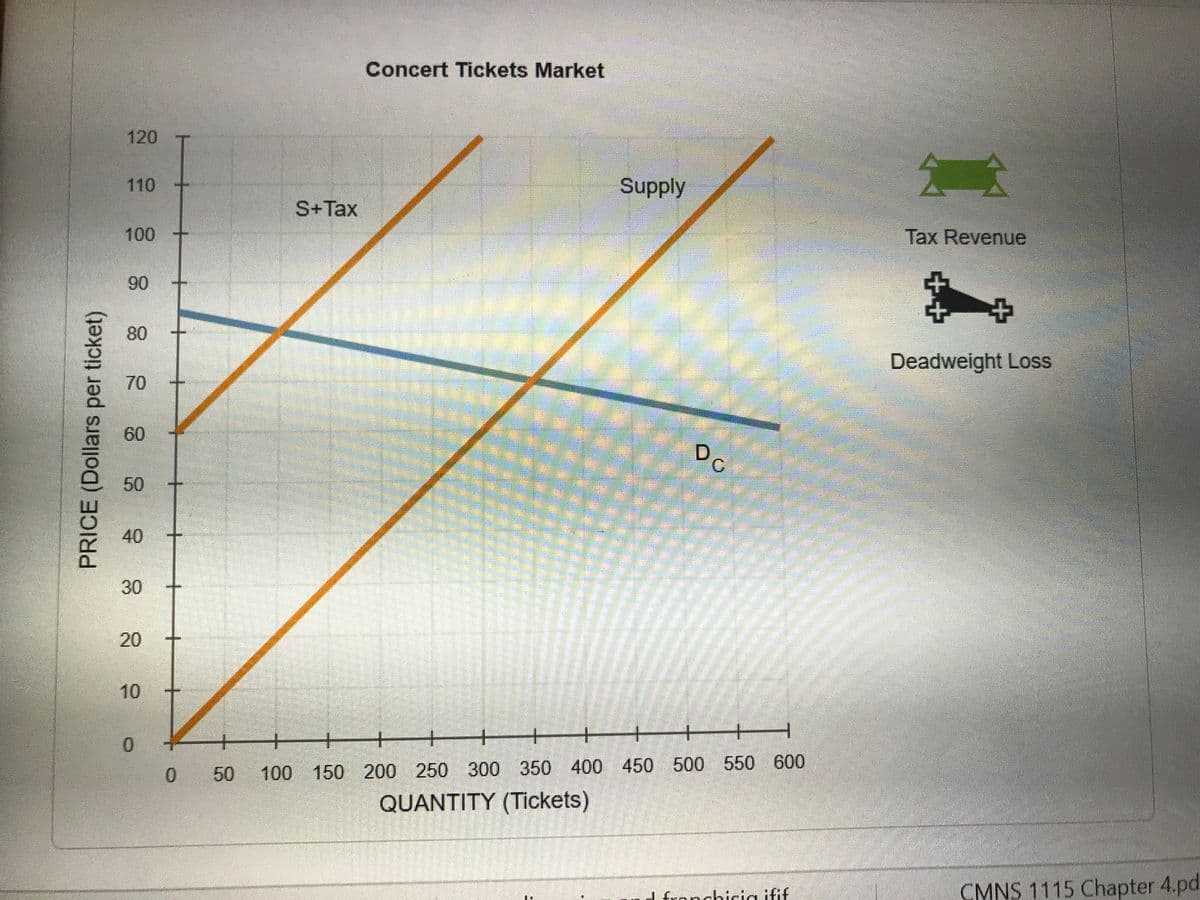
Suppose the government taxes concert tickets. The following graph shows the annual supply and demand for this good. It also shows the supply curve (S+TaxS+Tax) shifted up by the amount of the proposed tax ($60 per ticket).
On the following graph, use the green rectangle (triangle symbols) to shade the area that represents tax revenue for concert tickets. Then use the black triangle (plus symbols) to shade the area that represents the deadweight loss associated with the tax.
Concert Tickets MarketTax RevenueDeadweight Loss0501001502002503003504004505005506001201101009080706050403020100PRICE (Dollars per ticket)QUANTITY (Tickets)DCSupplyS+Tax
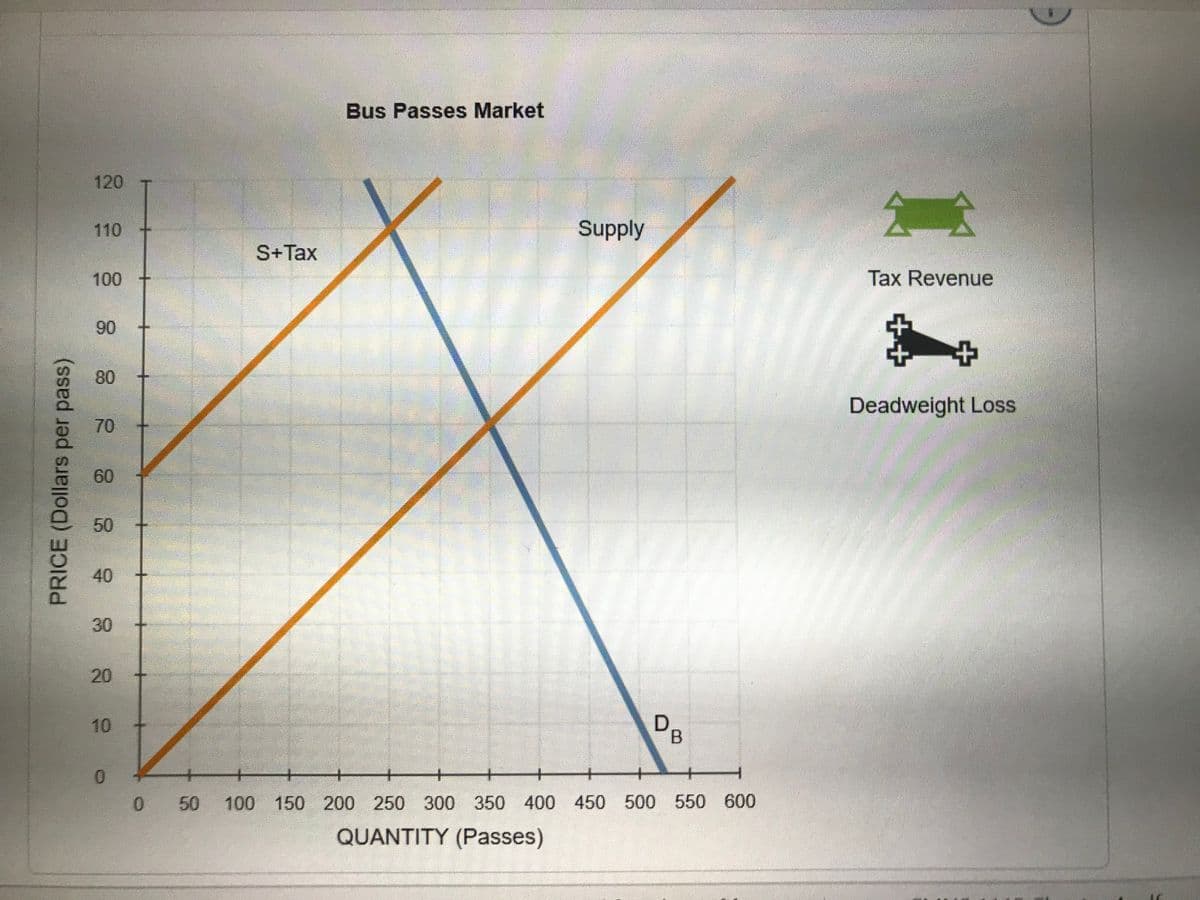
Instead, suppose the government taxes bus passes. The following graph shows the annual supply and demand for this good, as well as the supply curve shifted up by the amount of the proposed tax ($60 per pass).
On the following graph, do the same thing that you did on the graph for concert tickets. Use the green rectangle (triangle symbols) to shade the area that represents tax revenue for bus passes. Then, use the black triangle (plus symbols) to shade the area that represents the deadweight loss associated with the tax.
Bus Passes MarketTax RevenueDeadweight Loss0501001502002503003504004505005506001201101009080706050403020100PRICE (Dollars per pass)QUANTITY (Passes)DBSupplyS+Tax
Complete the following table with the tax revenue collected and deadweight loss caused by each of the tax proposals.
|
If the Government Taxes...
|
Tax Revenue
|
Deadweight Loss
|
|---|---|---|
|
(Dollars)
|
(Dollars)
|
|
| Concert tickets at $60 per ticket |
|
|
| Bus passes at $60 per pass |
|
|
Suppose the government wants to tax the good that will generate more tax revenue at a lower welfare cost. In this case, it should tax because, all else held constant, taxing a good with a relatively elastic demand generates larger tax revenue and smaller deadweight loss.
Transcribed Image Text:Concert Tickets Market
120
110
Supply
S+Tax
100
Tax Revenue
90
80
Deadweight Loss
70
60
Do
50
30
10
一
100 150 200 250 300 350 400 450 500 550 600
QUANTITY (Tickets)
50
d fronchicia ifif
CMNS 1115 Chapter 4.pd.
40
20
PRICE (Dollars per ticket)
Transcribed Image Text:Bus Passes Market
120
110
Supply
S+Tax
100
Tax Revenue
90
80
Deadweight Loss
70
60
50
40
30
20
D.
B.
10
0 50
100 150 200 250 300 350 400 450 500 550 600
QUANTITY (Passes)
PRICE (Dollars per pass)
++
Expert Solution
This question has been solved!
Explore an expertly crafted, step-by-step solution for a thorough understanding of key concepts.

This is a popular solution!

Trending now
This is a popular solution!

Step by step
Solved in 4 steps with 2 images

Knowledge Booster


Learn more about
Need a deep-dive on the concept behind this application? Look no further. Learn more about this topic, economics and related others by exploring similar questions and additional content below.Recommended textbooks for you
Principles of Economics (MindTap Course List)
Economics
ISBN:
9781305585126
Author:
N. Gregory Mankiw
Publisher:
Cengage Learning

Principles of Microeconomics (MindTap Course List)
Economics
ISBN:
9781305971493
Author:
N. Gregory Mankiw
Publisher:
Cengage Learning

Principles of Economics, 7th Edition (MindTap Cou…
Economics
ISBN:
9781285165875
Author:
N. Gregory Mankiw
Publisher:
Cengage Learning
Principles of Economics (MindTap Course List)
Economics
ISBN:
9781305585126
Author:
N. Gregory Mankiw
Publisher:
Cengage Learning
Principles of Microeconomics (MindTap Course List)
Economics
ISBN:
9781305971493
Author:
N. Gregory Mankiw
Publisher:
Cengage Learning
Principles of Economics, 7th Edition (MindTap Cou…
Economics
ISBN:
9781285165875
Author:
N. Gregory Mankiw
Publisher:
Cengage Learning

Managerial Economics: Applications, Strategies an…
Economics
ISBN:
9781305506381
Author:
James R. McGuigan, R. Charles Moyer, Frederick H.deB. Harris
Publisher:
Cengage Learning