9.14 8.13 8.75 8.76 9.25 8.11 6.14 3.11 9.12 7.26 4.75 E Click here to view a table of critical values for the correlation coefficient. .... a. Construct a scatterplot. Choose the correct graph below. OA. OB. Oc. OD. AY 10- 8- 6- AY 10- 8- Ay 10- 10- 8- 8- 6- 4- 6- 6- ..... 4- 4- 4- 2- 2- 2- 2- 04 12 16 12 16 b. Find the linear correlation coefficient, r, then determine whether there is sufficient evidence to support the claim of a linear correlation between the two variables. The linear correlation coefficient is r=. (Round to three decimal places as needed.) Using the linear correlation coefficient found in the previous step, determine whether there is sufficient evidence to support the claim of a linear correlation between the two variables. Choose the correct answer below. O A. There is sufficient evidence to support the claim of a nonlinear correlation between the two variables. B. There is insufficient evidence to support the claim of a nonlinear correlation between the two variables. c. There is sufficient evidence to support the claim of a linear correlation between the two variables. O D. There is insufficient evidence to support the claim of a linear correlation between the two variables. c. Identify the feature of the data that would be missed if part (b) was completed without constructing the scatterplot. Choose the correct answer below. O A. The scatterplot does not reveal a distinct pattern. O B. The scatterplot reveals a distinct pattern that is a straight-line pattern with negative slope. Oc. The scatterplot reveals a distinct pattern that is not a straight-line pattern. O D. The scatterplot reveals a distinct pattern that is a straight-line pattern with positive slope.
9.14 8.13 8.75 8.76 9.25 8.11 6.14 3.11 9.12 7.26 4.75 E Click here to view a table of critical values for the correlation coefficient. .... a. Construct a scatterplot. Choose the correct graph below. OA. OB. Oc. OD. AY 10- 8- 6- AY 10- 8- Ay 10- 10- 8- 8- 6- 4- 6- 6- ..... 4- 4- 4- 2- 2- 2- 2- 04 12 16 12 16 b. Find the linear correlation coefficient, r, then determine whether there is sufficient evidence to support the claim of a linear correlation between the two variables. The linear correlation coefficient is r=. (Round to three decimal places as needed.) Using the linear correlation coefficient found in the previous step, determine whether there is sufficient evidence to support the claim of a linear correlation between the two variables. Choose the correct answer below. O A. There is sufficient evidence to support the claim of a nonlinear correlation between the two variables. B. There is insufficient evidence to support the claim of a nonlinear correlation between the two variables. c. There is sufficient evidence to support the claim of a linear correlation between the two variables. O D. There is insufficient evidence to support the claim of a linear correlation between the two variables. c. Identify the feature of the data that would be missed if part (b) was completed without constructing the scatterplot. Choose the correct answer below. O A. The scatterplot does not reveal a distinct pattern. O B. The scatterplot reveals a distinct pattern that is a straight-line pattern with negative slope. Oc. The scatterplot reveals a distinct pattern that is not a straight-line pattern. O D. The scatterplot reveals a distinct pattern that is a straight-line pattern with positive slope.

Glencoe Algebra 1, Student Edition, 9780079039897, 0079039898, 2018
18th Edition
ISBN:9780079039897
Author:Carter
Publisher:Carter
Chapter10: Statistics
Section10.4: Distributions Of Data
Problem 19PFA

Related questions
Question
Use the given data set to complete parts (a) through (c) below. (Use
α=0.05.)
|
x
|
10
|
8
|
13
|
9
|
11
|
14
|
6
|
4
|
12
|
7
|
5
|
|
|---|---|---|---|---|---|---|---|---|---|---|---|---|
|
y
|
9.14
|
8.13
|
8.75
|
8.76
|
9.25
|
8.11
|
6.14
|
3.11
|
9.12
|
7.26
|
4.75
|
|
LOADING...
a. Construct a scatterplot . Choose the correct graph below.
b. Find the linear correlation coefficient, r, then determine whether there is sufficient evidence to support the claim of a linear correlation between the two variables.
The linear correlation coefficient is
r=enter your response here.
(Round to three decimal places as needed.)
Using the linear correlation coefficient found in the previous step, determine whether there is sufficient evidence to support the claim of a linear correlation between the two variables. Choose the correct answer below.
There is
sufficient
evidence to support the claim of a nonlinear correlation between the two variables.There is
insufficient
evidence to support the claim of a nonlinear correlation between the two variables.There is
sufficient
evidence to support the claim of a linear correlation between the two variables.There is
insufficient
evidence to support the claim of a linear correlation between the two variables.c. Identify the feature of the data that would be missed if part (b) was completed without constructing the scatterplot. Choose the correct answer below.
The scatterplot does not reveal a distinct pattern.
The scatterplot reveals a distinct pattern that is a straight-line pattern with negative slope.
The scatterplot reveals a distinct pattern that is not a straight-line pattern.
The scatterplot reveals a distinct pattern that is a straight-line pattern with positive slope.
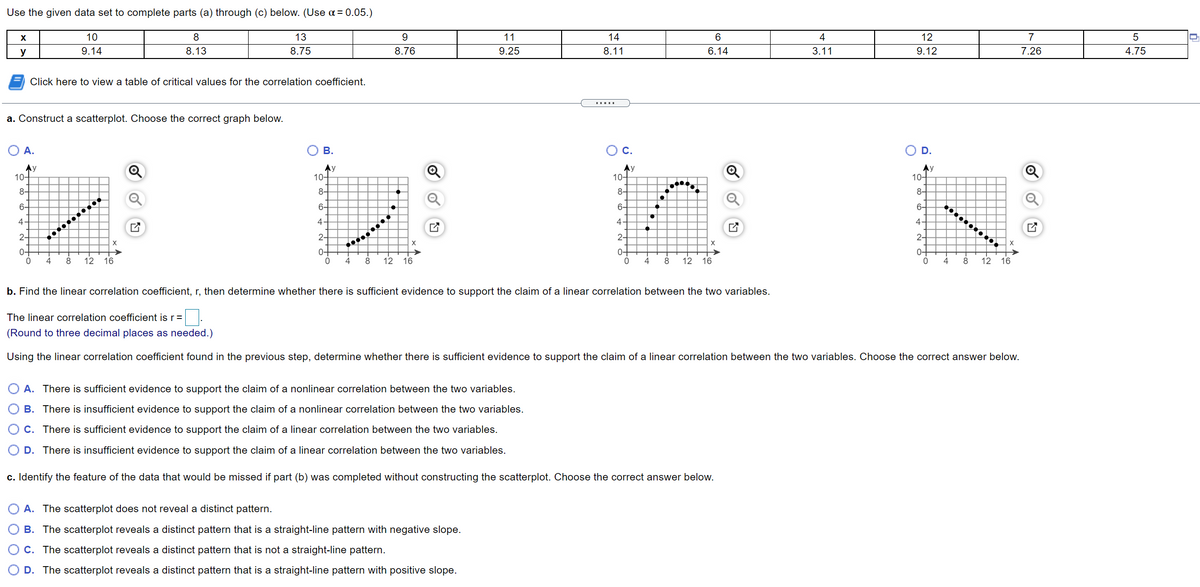
Transcribed Image Text:Use the given data set to complete parts (a) through (c) below. (Use a = 0.05.)
X
10
8
13
9.
11
14
6
12
7
y
9.14
8.13
8.75
8.76
9.25
8.11
6.14
3.11
9.12
7.26
4.75
Click here to view a table of critical values for the correlation coefficient.
a. Construct a scatterplot. Choose the correct graph below.
in:
A.
В.
C.
D.
Ay
10-
Ay
10-
Ay
10-
Ay
10-
8-
8-
8-
8-
6-
6-
6-
6-
4
4
4.
4-
2-
2-
2-
2-
X
X
0-
0-
0-
4
0-
8
12 16
8
12
16
4
8
12
16
4
8
12
16
b. Find the linear correlation coefficient, r, then determine whether there is sufficient evidence to support the claim of a linear correlation between the two variables.
The linear correlation coefficient is r=
(Round to three decimal places as needed.)
Using the linear correlation coefficient found in the previous step, determine whether there is sufficient evidence to support the claim of a linear correlation between the two variables. Choose the correct answer below.
A. There is sufficient evidence to support the claim of a nonlinear correlation between the two variables.
B. There is insufficient evidence to support the claim of a nonlinear correlation between the two variables.
O C. There is sufficient evidence to support the claim of a linear correlation between the two variables.
O D. There is insufficient evidence to support the claim of a linear correlation between the two variables.
c. Identify the feature of the data that would be missed if part (b) was completed without constructing the scatterplot. Choose the correct answer below.
O A. The scatterplot does not reveal a distinct pattern.
B. The scatterplot reveals a distinct pattern that is a straight-line pattern with negative slope.
C. The scatterplot reveals a distinct pattern that is not a straight-line pattern.
O D. The scatterplot reveals a distinct pattern that is a straight-line pattern with positive slope.
of
O O O O
Expert Solution
This question has been solved!
Explore an expertly crafted, step-by-step solution for a thorough understanding of key concepts.

This is a popular solution!

Trending now
This is a popular solution!

Step by step
Solved in 7 steps with 7 images

Recommended textbooks for you
Glencoe Algebra 1, Student Edition, 9780079039897…
Algebra
ISBN:
9780079039897
Author:
Carter
Publisher:
McGraw Hill
Glencoe Algebra 1, Student Edition, 9780079039897…
Algebra
ISBN:
9780079039897
Author:
Carter
Publisher:
McGraw Hill