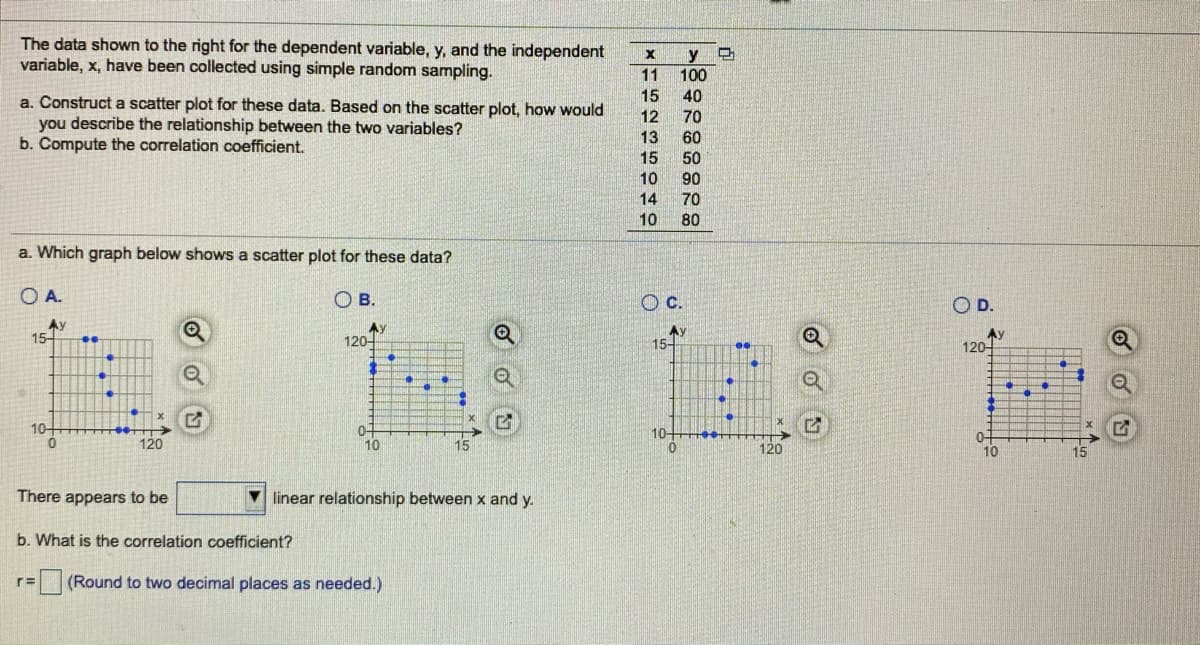
The data shown to the right for the dependent variable, y, and the independent variable, x, have been collected using simple random sampling. y 100 40 70 11 15 a. Construct a scatter plot for these data. Based on the scatter plot, how would you describe the relationship between the two variables? b. Compute the correlation coefficient. 12 13 15 60 50 10 90 14 70 10 80 a. Which graph below shows a scatter plot for these data? O A. OB. Oc. OD. Ay 15- Ay 120- Ay 120- 15- 10- 0- 10 10- 120 0- 10 120 There appears to be linear relationship between x and y. b. What is the correlation coefficient? (Round to two decimal places as needed.) r=


Correlation
Correlation defines a relationship between two independent variables. It tells the degree to which variables move in relation to each other. When two sets of data are related to each other, there is a correlation between them.
Linear Correlation
A correlation is used to determine the relationships between numerical and categorical variables. In other words, it is an indicator of how things are connected to one another. The correlation analysis is the study of how variables are related.
Regression Analysis
Regression analysis is a statistical method in which it estimates the relationship between a dependent variable and one or more independent variable. In simple terms dependent variable is called as outcome variable and independent variable is called as predictors. Regression analysis is one of the methods to find the trends in data. The independent variable used in Regression analysis is named Predictor variable. It offers data of an associated dependent variable regarding a particular outcome.


Trending now
This is a popular solution!

Step by step
Solved in 2 steps with 2 images


