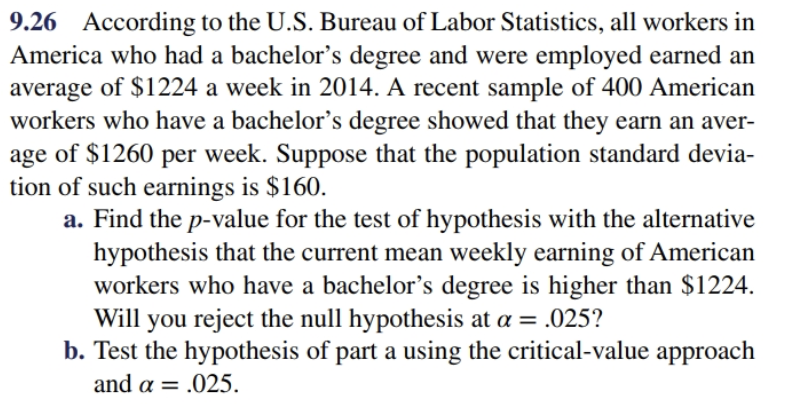
9.26 According to the U.S. Bureau of Labor Statistics, all workers in America who had a bachelor's degree and were employed earned an average of $1 224 a week in 2014. A recent sample of 400 American workers who have a bachelor's degree showed that they earn an aver- age of $1260 per tion of such earnings is $160. a. Find the p-value for the test of hypothesis with the alternative hypothesis that the current mean weekly earning of American workers who have a bachelor's degree is higher than $1224 Will you reject the null hypothesis at a .025? b. Test the hypothesis of part a using the critical-value approach and α week. Suppose that the population standard devia- 025
Q: A real estate company is interested in testing whether the mean time that families in Gotham have…
A: Solution: Given information: nG= 100 Sample size of Gotham families nM=150 Sample size of Metropolis…
Q: 4. 3,539 participants attended the seventh examination of the Offspring in the Fram- ingham Heart…
A: The random variable systolic blood pressure is normally distributed. There are two samples which are…
Q: A market research firm used a sample of individuals to rate the purchase potential of a particular…
A:
Q: In an experiment to determine whether ther is a systematic difference between the weights obtained…
A: Hypotheses for the test is given below:
Q: wenty laboratory mice were randomly divided into two groups of 10. Each group was fed according to a…
A: A B 7 18 14 15 5 22 11 9 8 22 10 8 11 22 8 14 9 16 14 19…
Q: Which of the following is not needed to compute a t-statistic, and do a one-sample t-test? (Hint:…
A: Formula for t statistic :
Q: Fowle Marketing Research bases charges to a client on the assumption that telephone surveys can be…
A: Since you have posted a question with multiple subparts, we will solve first three subparts for you.…
Q: Interpret the following statement regarding the statistical findings of a research study. “61% (n =…
A: Introduction: The outcome of a study involving low-carbohydrate and low-fat diets is given.
Q: A market research firm used a sample of individuals to rate the purchase potential of a particular…
A: The following data is given, Individuals Before After 1 6 6 2 6 4 3 7 7 4 4 3 5 3 4 6…
Q: 1. A government agency is investigating a complaint from some concerned citizens who said that there…
A: The random variable weight of each sack follows normal distribution. We have to test whether the…
Q: A market research firm used a sample of individuals to rate the purchase potential of a particular…
A:
Q: market research firm used a sample of individuals to rate the purchase potential of a particular…
A: Given that Sample size n =8 Level of significance =alpha =0.05 Degree of freedom =df = n-1=7
Q: (b) The mean height of all adult American males is 69 inches (5 ft 9 in). A researcher wonders if…
A: Given that Sample size n =100 Sample mean =71 Population mean =69 NOTE:- According to bartleby…
Q: sed on data from the U.S. Bureau of Economic Analysis). Tom ns to open a Cadillac car dealership and…
A: The claim is that the sample was drawn from a population with mean 13901. The null hypothesis is,…
Q: on pieces of SPM wood of which 100 pieces were stored inside a warehouse and 40 outside. The means…
A:
Q: Fowle Marketing Research, Inc., bases charges to a client on the assumption that telephone surveys…
A: We have given that data Sample size n = 35 Population mean μ = 15 Population standard deviation =…
Q: A market research firm used a sample of individuals to rate the purchase potential of a particular…
A: Suppose μd is the difference of purchase rating after and before.
Q: 12. Callahan (2009) demonstrated that tai chi can signifi- cantly reduce symptoms for individuals…
A: The following information is provided. mean=MD=8.5Standard deviation=sD=21.5Sample size=n=40
Q: The Global Business Travel Association reported the domestic airfare for business travel for the…
A: Paired t test is used when sample sizes are equal and samples are paired i.e. not independent. This…
Q: (a) Find t. (Give your answer correct to two decimal places.) This answer is 2.46 (ii) Find the…
A: We have used the excel data analysis tool to run the t-test
Q: A news article reported that college students who have part-time jobs work an average of 15 hours…
A:
Q: The paper "Undergraduate Marijuana Use and Anger" (J of Psych. (1988): 343-347) reported that the…
A: Given Data: x¯1=39.72 s1=4.05 n1=27x¯2=45.92 s2=3.18 n2=25 Calculating the…
Q: Oishi and Shigehiro (2010) report that people who move from home to home frequently as children tend…
A: The given data set is: 38 37 41 35 42 40 33 33 36 38 32 39 Thus, the…
Q: A study at Auckland's Green Lane Hospital looked at the effect of length of fast on stomach pH…
A:
Q: An experiment is conducted to determine the time evolution of the mean increases in growth produced…
A:
Q: Consumer Reports stated that the mean time for a Chrysler Concorde to go from 0 to 60 miles per hour…
A: a) Null and alternative hypotheses: The hypothesis which is tentatively fixed up under and tested…
Q: random sample of 75 eighth-grade students score's on a national mathematics assessment test has a…
A: Given
Q: Answer the following questions. 2A. The mean length of a work week for the population of workers was…
A: 2.AGiven that,Population mean (µ) = 45Sample size (n) = 100Sample mean (x-bar) = 42Sample standard…
Q: 1. A researcher claims that the amounts of acetaminophen in a certain brand of cold tablets have a…
A: In testing of hypothesis, there are always two hypotheses. These are null and alternative…
Q: The makers of Country Boy Corn Flakes are thinking about changing the packaging of the cereal with…
A: The given dataset is: Cube cylinder pyramid Rectangle 116 111 78 166 82…
Q: 5% level of significance, do the data provide strong evidence that the mean difference is not equal…
A: Given data : sample size, nD = n =23 sample mean,X¯D = x̄ = -8 sample standard…
Q: Twenty laboratory mice were randomly divided into two groups of 10. Each group was fed according to…
A:
Q: he average cost of tuition and room and board for a small private liberal arts college is reported…
A: Given µ =$9,000 Hypothesis is H0: µ ≤ $9,000; H1: µ > $9,000
Q: 12. Callahan (2009) demonstrated that tai chi can signifi- cantly reduce symptoms for individuals…
A:
Q: In their 2003 and 2008 studies on how long wireless customers have to spend on hold before speaking…
A: Let μ1 denotes the mean time on hold for 2008 and μ2 denotes the mean time on hold for 2003.…
Q: To see if young men ages 8-17 years spend a different amount than the national average of $24.44 per…
A: The random variable amount spent for shopping trip follows normal distribution. The population mean…
Q: State the null and alternative hypothesis that would be used to test the following claims. а) There…
A: Claim1: There is difference between the mean ages of medical staff at two different hospitals.…
Q: Watch Corporation of Switzerland claims that its watches on average will neither gain nor lose time…
A: Given information:A sample of 18 watches provided the following gains (+) or losses (-) in seconds…
Q: In the article "Uncertainty Estimation in Railway Track Life-Cycle Cost" (Journal of Rail and Rapid…
A:
Q: Individual Purchase Rating After Before 1 6 5 2 6 5 3 7 7 4 4 3 5 3 6 6 9 8 7 7 5 8 6 7
A: Let d be the difference between purchase potential ratings after and before he individuals saw a new…
Q: Is the length of time of unemployment related to the type of industry? A random sample of unemployed…
A: The row and column totals are, Less than 5 weeks 5-14 weeks 15-26 weeks Total Transportation…
Q: market research firm used a sample of individuals to rate the purchase potential of a particular…
A: Given that Level of significance =alpha =0.05 Sample size n =8 Degree of freedom =df= n-1
Q: A health researcher is trying to determine if a weight loss program is effective. To do this, she…
A:
Q: Consumer Reports stated that the mean time for a Chrysler Concorde to go from 0 to 60 miles per hour…
A: Since you have posted multiple sub-parts, we will solve the first three sub-parts for you. To get…
Q: There is a claim that playing e-sport increase food intake. The following table (Table 2) shows data…
A:
Q: The table below summarizes baseline characteristics of patients participating in a clinical trial.…
A: Answer : The data represents baseline characterstics on patients participating in a clinical trial.
Q: An agency that hires out clerical workers claims its workers can type, on average, at least 60 words…
A: p-value p-value – It is the probability of obtaining the test results as extreme as the results…
Q: A manufacturer of cellular phone batteries took a sample of 13 from a day's production and used them…
A: NOTE: As per the guidelines, we are supposed to solve the first three sub parts only. Given: Data:…
Q: Callahan (2009) demonstrated that tai chi can significantly reduce symptoms for individuals with…
A: Let, X1: The decrease in pain. X2: The decrease in stiffness. MD = 8.5 Standard deviation = SD =…
Q: Watch Corporation of Switzerland claims that its watches on average will neither gain nor lose time…
A: The single mean t-test is used to compare the mean of a variable in a sample of data to a mean in…
Trending now
This is a popular solution!
Step by step
Solved in 5 steps with 3 images
- In a study that compared average time taken by a men and women to do a certain job, a random sample of 13 men and 13 women at a large industrial complex was taken and the following results were obtained. Men Women ?̅ = 54 ??????? ?̅ = 42 ??????? ? = 6 ??????? ? = 8 ??????? Can we conclude that at 0.01 level that women do the job on average 10 minutes earlier than men? Assume the populations to be normally distributed with equal variances.The NAEP considers that a national average of 283 is an acceptable performance. Using α = .05, run a two-tail t-test for one sample to test Ho: µ=283 for the 2019 scores. Report the t-obt, df, and p-values. Would you reject the null hypothesis that the 2019 scores come from a population with average 283? If this is the case, does it come from a population from larger or smaller average?A sample of men and women who had passed their driver's test either the first time or the second time were surveyed, with the following results: Results of the driving testGender First time Second timeMen 126 211Women 135 178a) Do these data suggest that there is a relationship between gender and the passing of their driver’s test from which the present sample was drawn? Let alpha=.05
- 31% of all pygmy softshell toises have stripes on their shells. A herpetologist in Cititon collects a sample of 28 pygmy softshell tortoises and finds that 8 of them have stripes on their shells. Is there enough evidence to conclude, at a significance of alpha=0.05, that the proportion of pygmy softshell tortoises in Cititon with stripes on their shells is less than 31%? What is the claim? What is the null hypothesis? What is the alternative hypothesis? What is the test statistic? What is/are the critical value(s)? Do we reject the null hypothesis? What conclusion do we draw? What is the P-value for the problem above?A researcher administers a treatment to a sample from a population with a mean of m=50. If the treatment is expected to increase scores and a one-tailed test is used to evaluate the treatment effect, the the null hypothesis states that m=40. True or false?Suppose a research study uses two independent groups with 21 individuals in each group. If a t-test analysis produces a calculated value of t of 1.68, which of the following is the correct decision?A. At the .05 level of significance, reject the null hypothesisB. At the .01 level of significance, reject the null hypothesisC. At the .05 level of significance, fail to reject the null hypothesisD. Impossible to answer without additional information
- The paper "Living Near Nuclear Power Plants and Thyroid Cancer Risks"† investigated whether living near a nuclear power plant increases the risk of thyroid cancer. The authors of this paper concluded that there was no evidence of increased risk of thyroid cancer in areas that were near a nuclear power plant. (a) Let p denote the proportion of the population in areas near nuclear power plants who are diagnosed with thyroid cancer during a given year. The researchers who wrote this paper might have considered the two rival hypotheses of the form below. H0: p is equal to the corresponding value for areas without nuclear power plants Ha: p is greater than the corresponding value for areas without nuclear power plants Did the researchers reject H0or fail to reject H0?The researchers rejected H0. The researchers failed to reject H0. (b) If the researchers are incorrect in their conclusion that there is no evidence of increased risk of thyroid cancer associated with living near a nuclear…Researchers conducted an experiment in which people with a certain condition were given either a drug or a placebo to treat the condition. At the significance level of α=0.01α=0.01, a test of the following hypotheses was conducted. H0:pD=pPHa:pD>pPH0:pD=pPHa:pD>pP In the hypotheses, pDpD represents the proportion of all people who experience an allergic reaction while taking the drug, and pPpP represents the proportion of all people who experience an allergic reaction while taking the placebo. All conditions for inference were met, and the resulting pp-value was 0.12. Which of the following is the correct decision for the test? The pp-value is less than αα, and the null hypothesis is rejected. There is convincing evidence to support the claim that the proportion of people with an allergic reaction will be greater for those taking the drug than for those taking the placebo. A The pp-value is less than αα, and the null hypothesis is rejected. There is…One survey showed that among 766 randomly selected subjects who completed four years of college, 18.3% smoke and 81.7% do not smoke. Use a 0.01 significance level to test the claim that the rate of smoking among those with four years of college is less than the 27% rate for the general population. . Calculate the P-value. Which of these options is closest to the P-value? A. 0.0005 B. 0.9999 C. 0.5000 D. 0.0001 e. State the technical conclusion. A. Do not reject Upper H 0 B. Reject Upper H 0 f. State the final conclusion. A. The sample data support the claim. B. There is sufficient evidence to warrant rejection of the claim. C. There is not sufficient evidence to warrant rejection of the claim. D. There is not sufficient sample evidence to support the claim. g. Based on the results, does it appear that those who completed four years of college…
- Also, using α = .05, run a two-tail t-test for one sample to test Ho: µ=283 for the 2009 scores. Report the t-obt, df, and p-values. Would you reject the null hypothesis that the 2009 scores come from a population with average 283? If this is the case, does it come from a population from larger or smaller average?A researcher conducts a study measuring 15 children before and after they attend a math intervention program to increase standardized math scores. The researcher obtains a t statistic of 2.98. For a two-tailed alternative hypothesis, which of the following is the correct way to present this analysis?12. A researcher conducts an independent-measures studycomparing two treatments and reports the t statistic ast(30) 2.085.a. How many individuals participated in the entire study?b. Using a two-tailed test with .05, is there asignificant difference between the two treatments?c. Compute r2 to measure the percentage of varianceaccounted for by the treatment effect.