The NAEP considers that a national average of 283 is an acceptable performance. Using α = .05, run a two-tail t-test for one sample to test Ho: µ=283 for the 2019 scores. Report the t-obt, df, and p-values. Would you reject the null hypothesis that the 2019 scores come from a population with average 283? If this is the case, does it come from a population from larger or smaller average?
The NAEP considers that a national average of 283 is an acceptable performance. Using α = .05, run a two-tail t-test for one sample to test Ho: µ=283 for the 2019 scores. Report the t-obt, df, and p-values. Would you reject the null hypothesis that the 2019 scores come from a population with average 283? If this is the case, does it come from a population from larger or smaller average?

Algebra & Trigonometry with Analytic Geometry
13th Edition
ISBN:9781133382119
Author:Swokowski
Publisher:Swokowski
Chapter10: Sequences, Series, And Probability
Section10.8: Probability
Problem 30E

Related questions
Question
The NAEP considers that a national average of 283 is an acceptable performance. Using α = .05, run a two-tail t-test for one sample to test Ho: µ=283 for the 2019 scores. Report the t-obt, df, and p-values.
Would you reject the null hypothesis that the 2019 scores come from a population with average 283? If this is the case, does it come from a population from larger or smaller average?
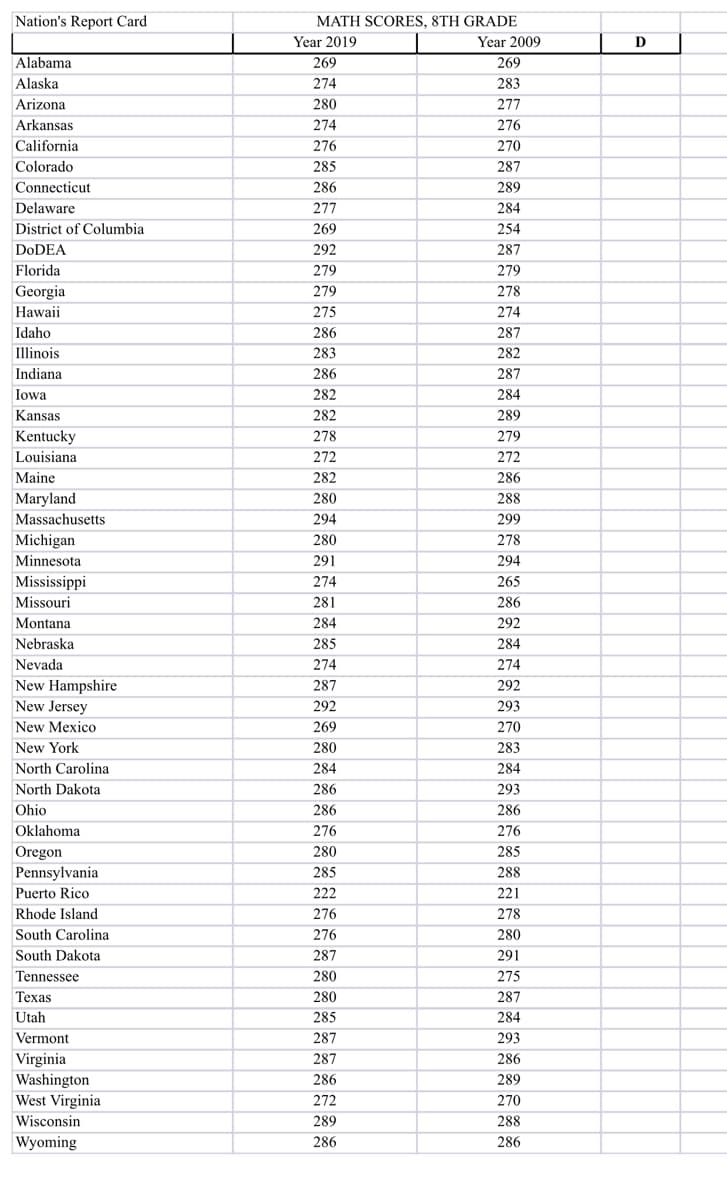
Transcribed Image Text:Nation's Report Card
MATH SCORES, 8TH GRADE
Year 2019
Year 2009
D
Alabama
269
269
Alaska
274
283
Arizona
280
277
Arkansas
274
276
California
276
270
Colorado
285
287
Connecticut
286
289
Delaware
277
284
District of Columbia
269
254
DODEA
292
287
Florida
279
279
Georgia
279
278
Hawaii
275
274
Idaho
286
287
Illinois
283
282
Indiana
286
287
Iowa
282
284
Kansas
282
289
Kentucky
278
279
Louisiana
272
272
Maine
282
286
Maryland
280
288
Massachusetts
294
299
Michigan
280
278
Minnesota
291
294
Mississippi
274
265
Missouri
281
286
Montana
284
292
Nebraska
285
284
Nevada
New Hampshire
New Jersey
274
274
287
292
292
293
New Mexico
269
270
New York
280
283
North Carolina
284
284
North Dakota
286
293
Ohio
286
286
Oklahoma
276
276
Oregon
Pennsylvania
280
285
285
288
Puerto Rico
222
221
Rhode Island
276
278
South Carolina
276
280
South Dakota
287
291
Tennessee
280
275
Texas
280
287
Utah
285
284
Vermont
287
293
Virginia
Washington
West Virginia
287
286
286
289
272
270
Wisconsin
289
288
Wyoming
286
286
Expert Solution
This question has been solved!
Explore an expertly crafted, step-by-step solution for a thorough understanding of key concepts.

This is a popular solution!

Trending now
This is a popular solution!

Step by step
Solved in 2 steps with 4 images

Recommended textbooks for you
Algebra & Trigonometry with Analytic Geometry
Algebra
ISBN:
9781133382119
Author:
Swokowski
Publisher:
Cengage
Algebra & Trigonometry with Analytic Geometry
Algebra
ISBN:
9781133382119
Author:
Swokowski
Publisher:
Cengage