9.9 Driving (Example 10) Drivers in Wyoming drive more miles yearly than motorists in any other state. The annual number of miles driven per licensed driver in Wyoming is 22,306 miles. Assume the standard deviation is 5500 miles. A random sample of 200 licensed drivers in Wyoming is selected and the mean number of miles driven yearly for the sample is calculated. (Source: 2017 World Almanac and Book of Facts) a. What value would we expect for the sample mean? b. What is the standard error for the sample mean?
9.9 Driving (Example 10) Drivers in Wyoming drive more miles yearly than motorists in any other state. The annual number of miles driven per licensed driver in Wyoming is 22,306 miles. Assume the standard deviation is 5500 miles. A random sample of 200 licensed drivers in Wyoming is selected and the mean number of miles driven yearly for the sample is calculated. (Source: 2017 World Almanac and Book of Facts) a. What value would we expect for the sample mean? b. What is the standard error for the sample mean?

Glencoe Algebra 1, Student Edition, 9780079039897, 0079039898, 2018
18th Edition
ISBN:9780079039897
Author:Carter
Publisher:Carter
Chapter10: Statistics
Section10.4: Distributions Of Data
Problem 19PFA

Related questions
Question
9.9
Transcribed Image Text:331-9403-abf9e2add3f5/pages/affd70ec7715662884a92654be286553420cb1ef0?location=%7B"id"%3A...
x
lear
ion
d...
9.9
9.10
9: Inferring Population Means
times. Is this histogram a display of the population distribution, the distribution of a
sample, or the sampling distribution of means?
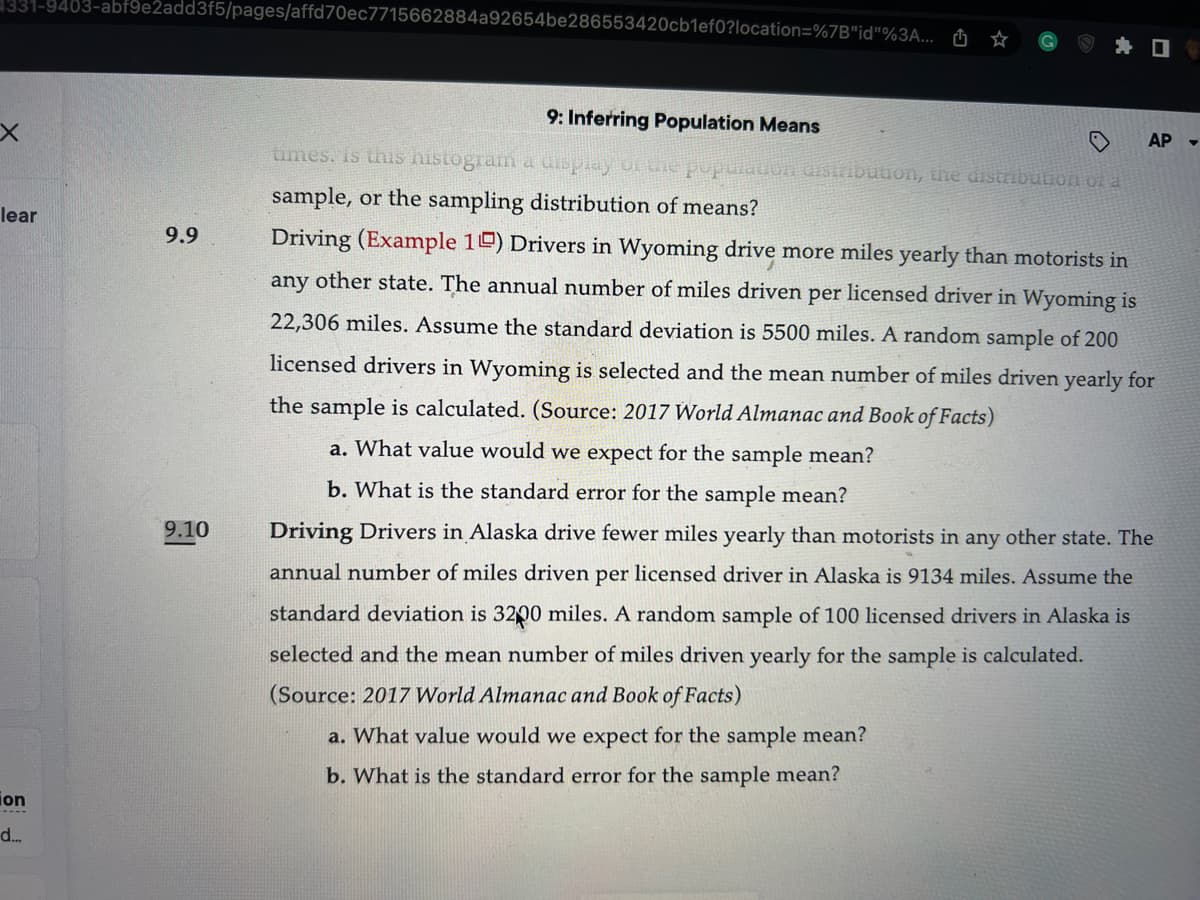
Driving (Example 10) Drivers in Wyoming drive more miles yearly than motorists in
any other state. The annual number of miles driven per licensed driver in Wyoming is
22,306 miles. Assume the standard deviation is 5500 miles. A random sample of 200
licensed drivers in Wyoming is selected and the mean number of miles driven yearly for
the sample is calculated. (Source: 2017 World Almanac and Book of Facts)
a. What value would we expect for the sample mean?
b. What is the standard error for the sample mean?
Driving Drivers in Alaska drive fewer miles yearly than motorists in any other state. The
annual number of miles driven per licensed driver in Alaska is 9134 miles. Assume the
standard deviation is 3200 miles. A random sample of 100 licensed drivers in Alaska is
selected and the mean number of miles driven yearly for the sample is calculated.
(Source: 2017 World Almanac and Book of Facts)
a. What value would we expect for the sample mean?
b. What is the standard error for the sample mean?
AP
Expert Solution
This question has been solved!
Explore an expertly crafted, step-by-step solution for a thorough understanding of key concepts.

This is a popular solution!

Trending now
This is a popular solution!

Step by step
Solved in 2 steps

Recommended textbooks for you
Glencoe Algebra 1, Student Edition, 9780079039897…
Algebra
ISBN:
9780079039897
Author:
Carter
Publisher:
McGraw Hill
Glencoe Algebra 1, Student Edition, 9780079039897…
Algebra
ISBN:
9780079039897
Author:
Carter
Publisher:
McGraw Hill