The accompanying data are the number of wins and the earned run averages (mean number of earned runs allowed per nine innings pitched) for eight baseball pitchers in a recent season. Find the equation of the regression line. Then construct a scatter plot of the data and draw the regression line. Then use the regression equation to predict the value of y for each of the given x-values, if meaningful. If the x-value is not meaningful to predict the value of y, explain why not. (a) x = 5 wins (b)x= 10 wins (c) x = 19 wins (d) x = 15 wins Click the icon to view the table of numbers of wins and earned run average. The equation of the regression line is y=x+ (Round to two decimal places as needed.) Construct a scatter plot of the data and draw the regression line. Choose the correct graph below. OA. (E AERA 6 Wins Q OB. Wins and ERA Wins, x 20 18 17 16 14 12 11 9 AERA Print Wins (a) Predict the ERA for 5 wins, if it is meaningful. Select the correct choice below and, if necessary, fill in the answer be Earned run average, y 2.83 3.37 2.71 3.76 3.85 4.29 3.79 5.06 Done O C. 0 AERA - Wins OD. AERA Wins 18 24 ot an x-value in the original data. vell outside the range of the original data. choice below and, if necessary, fill in the answer inside the range of the original data. not an x-value in the original data. hoice below and, if necessary, fill in the answer well outside the range of the original data. not an x-value in the original data. choice below and, if necessary, fill in the answer OA. y= (Round to two decimal places as needed.) OB. It is not meaningful to predict this value of y because x = 15 is inside the range of the original data. OC. It is not meaningful to predict this value of y because x = 15 is not an x-value in the original data.
The accompanying data are the number of wins and the earned run averages (mean number of earned runs allowed per nine innings pitched) for eight baseball pitchers in a recent season. Find the equation of the regression line. Then construct a scatter plot of the data and draw the regression line. Then use the regression equation to predict the value of y for each of the given x-values, if meaningful. If the x-value is not meaningful to predict the value of y, explain why not. (a) x = 5 wins (b)x= 10 wins (c) x = 19 wins (d) x = 15 wins Click the icon to view the table of numbers of wins and earned run average. The equation of the regression line is y=x+ (Round to two decimal places as needed.) Construct a scatter plot of the data and draw the regression line. Choose the correct graph below. OA. (E AERA 6 Wins Q OB. Wins and ERA Wins, x 20 18 17 16 14 12 11 9 AERA Print Wins (a) Predict the ERA for 5 wins, if it is meaningful. Select the correct choice below and, if necessary, fill in the answer be Earned run average, y 2.83 3.37 2.71 3.76 3.85 4.29 3.79 5.06 Done O C. 0 AERA - Wins OD. AERA Wins 18 24 ot an x-value in the original data. vell outside the range of the original data. choice below and, if necessary, fill in the answer inside the range of the original data. not an x-value in the original data. hoice below and, if necessary, fill in the answer well outside the range of the original data. not an x-value in the original data. choice below and, if necessary, fill in the answer OA. y= (Round to two decimal places as needed.) OB. It is not meaningful to predict this value of y because x = 15 is inside the range of the original data. OC. It is not meaningful to predict this value of y because x = 15 is not an x-value in the original data.

Functions and Change: A Modeling Approach to College Algebra (MindTap Course List)
6th Edition
ISBN:9781337111348
Author:Bruce Crauder, Benny Evans, Alan Noell
Publisher:Bruce Crauder, Benny Evans, Alan Noell
Chapter3: Straight Lines And Linear Functions
Section3.CR: Chapter Review Exercises
Problem 15CR: Life Expectancy The following table shows the average life expectancy, in years, of a child born in...

Related questions
Question
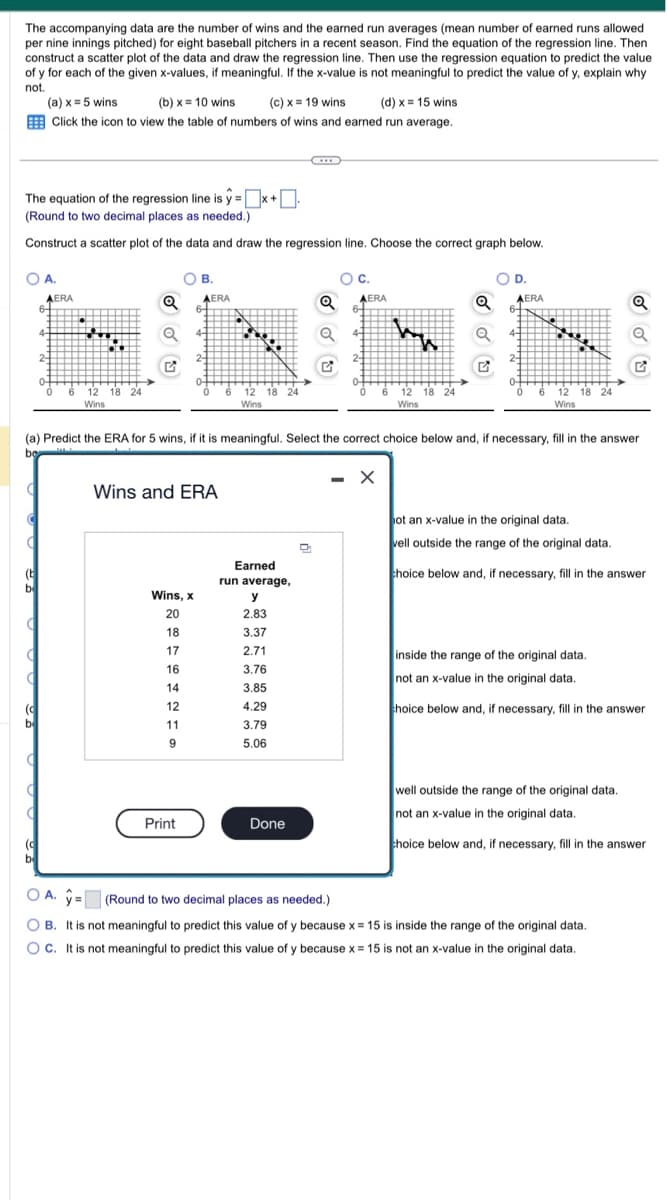
Transcribed Image Text:The accompanying data are the number of wins and the earned run averages (mean number of earned runs allowed
per nine innings pitched) for eight baseball pitchers in a recent season. Find the equation of the regression line. Then
construct a scatter plot of the data and draw the regression line. Then use the regression equation to predict the value
of y for each of the given x-values, if meaningful. If the x-value is not meaningful to predict the value of y, explain why
not.
The equation of the regression line is y=x+
(Round to two decimal places as needed.)
Construct a scatter plot of the data and draw the regression line. Choose the correct graph below.
OA.
C
C
(a) x = 5 wins
(b)x= 10 wins (c) x = 19 wins
(d) x = 15 wins
Click the icon to view the table of numbers of wins and earned run average.
(t
C
(c
b
AERA
6-
4-
2-
12 18 24
Wins
OB.
AERA
4-
Print
2-
Wins and ERA
12 18 24
Wins
Earned
run average,
Wins, x
y
20
2.83
18
3.37
17
2.71
IT
16
3.76
14
3.85
12
4.29
11
3.79
9
5.06
Done
Q
C
O C.
AERA
-
6-
4-
(a) Predict the ERA for 5 wins, if it is meaningful. Select the correct choice below and, if necessary, fill in the answer
be
my
X
W
12 18 24
Wins
OU
OD.
AERA
6-
4-
12 18 24
Wins
ot an x-value in the original data.
vell outside the range of the original data.
choice below and, if necessary, fill in the answer
inside the range of the original data.
not an x-value in the original data.
choice below and, if necessary, fill in the answer
well outside the range of the original data.
not an x-value in the original data.
choice below and, if necessary, fill in the answer
OA. y= (Round to two decimal places as needed.).
OB. It is not meaningful to predict this value of y because x = 15 is inside the range of the original data.
OC. It is not meaningful to predict this value of y because x = 15 is not an x-value in the original data.
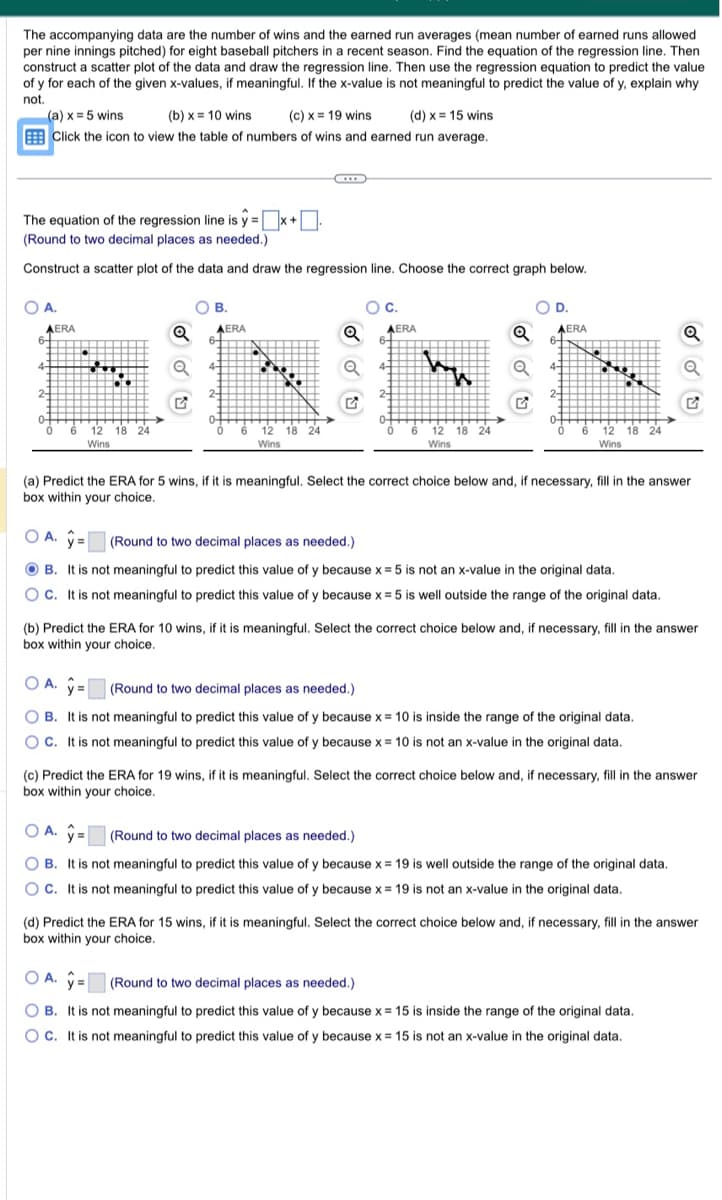
Transcribed Image Text:The accompanying data are the number of wins and the earned run averages (mean number of earned runs allowed
per nine innings pitched) for eight baseball pitchers in a recent season. Find the equation of the regression line. Then
construct a scatter plot of the data and draw the regression line. Then use the regression equation to predict the value
of y for each of the given x-values, if meaningful. If the x-value is not meaningful to predict the value of y, explain why
not.
(a) x = 5 wins
(b)x= 10 wins
(c) x = 19 wins
(d) x = 15 wins
Click the icon to view the table of numbers of wins and earned run average.
The equation of the regression line is y=x+
(Round to two decimal places as needed.)
Construct a scatter plot of the data and draw the regression line. Choose the correct graph below.
O A.
AERA
6+
4-
2-
O
0
6
A.
12 18 24
Wins
Q
B.
6-
4-
ERA
6
12 18 24
Wins
Q
G
O C.
AERA
6-
4-
6
ww
12 18 24
Wins
OA.
A. y= (Round to two decimal places as needed.).
Q
D.
AERA
6-
4-
6
****
(a) Predict the ERA for 5 wins, if it is meaningful. Select the correct choice below and, if necessary, fill in the answer
box within your choice.
(Round to two decimal places as needed.)
OB. It is not meaningful to predict this value of y because x = 5 is not an x-value in the original data.
OC. It is not meaningful to predict this value of y because x = 5 is well outside the range of the original data.
12 18 24
Wins
(b) Predict the ERA for 10 wins, if it is meaningful. Select the correct choice below and, if necessary, fill in the answer
box within your choice.
OA. = (Round to two decimal places as needed.).
OB. It is not meaningful to predict this value of y because x = 10 is inside the range of the original data.
OC. It is not meaningful to predict this value of y because x = 10 is not an x-value in the original data.
Q
(c) Predict the ERA for 19 wins, if it is meaningful. Select the correct choice below and, if necessary, fill in the answer
box within your choice.
O A.
(Round to two decimal places as needed.)
OB. It is not meaningful to predict this value of y because x = 19 is well outside the range of the original data.
OC. It is not meaningful to predict this value of y because x = 19 is not an x-value in the original data.
(d) Predict the ERA for 15 wins, if it is meaningful. Select the correct choice below and, if necessary, fill in the answer
box within your choice.
OB. It is not meaningful to predict this value of y because x = 15 is inside the range of the original data.
OC. It is not meaningful to predict this value of y because x = 15 is not an x-value in the original data.
Expert Solution
This question has been solved!
Explore an expertly crafted, step-by-step solution for a thorough understanding of key concepts.

This is a popular solution!

Trending now
This is a popular solution!

Step by step
Solved in 2 steps with 3 images

Recommended textbooks for you
Functions and Change: A Modeling Approach to Coll…
Algebra
ISBN:
9781337111348
Author:
Bruce Crauder, Benny Evans, Alan Noell
Publisher:
Cengage Learning

College Algebra
Algebra
ISBN:
9781305115545
Author:
James Stewart, Lothar Redlin, Saleem Watson
Publisher:
Cengage Learning

Algebra & Trigonometry with Analytic Geometry
Algebra
ISBN:
9781133382119
Author:
Swokowski
Publisher:
Cengage
Functions and Change: A Modeling Approach to Coll…
Algebra
ISBN:
9781337111348
Author:
Bruce Crauder, Benny Evans, Alan Noell
Publisher:
Cengage Learning
College Algebra
Algebra
ISBN:
9781305115545
Author:
James Stewart, Lothar Redlin, Saleem Watson
Publisher:
Cengage Learning
Algebra & Trigonometry with Analytic Geometry
Algebra
ISBN:
9781133382119
Author:
Swokowski
Publisher:
Cengage


Algebra and Trigonometry (MindTap Course List)
Algebra
ISBN:
9781305071742
Author:
James Stewart, Lothar Redlin, Saleem Watson
Publisher:
Cengage Learning