_1. What do you call he abl or graph that displays the frequency of various outcomes in a sample? A Frequency distribution 2 hstatistics, what is the number of times each dass occurs? A Limits B. Interval C. Range D. Raw data D. Data C.Frequency 3 What is the difference between the highest score and the lowest score of a data set? C. Range B. Interval A Fequency B. Interval D. Raw data
_1. What do you call he abl or graph that displays the frequency of various outcomes in a sample? A Frequency distribution 2 hstatistics, what is the number of times each dass occurs? A Limits B. Interval C. Range D. Raw data D. Data C.Frequency 3 What is the difference between the highest score and the lowest score of a data set? C. Range B. Interval A Fequency B. Interval D. Raw data
_1. What do you call he abl or graph that displays the frequency of various outcomes in a sample? A Frequency distribution 2 hstatistics, what is the number of times each dass occurs? A Limits B. Interval C. Range D. Raw data D. Data C.Frequency 3 What is the difference between the highest score and the lowest score of a data set? C. Range B. Interval A Fequency B. Interval D. Raw data
answer the multiple choice and the performance task 1 and 2
Transcribed Image Text:For itens number13- 15, use the table at the right
13. What is the lower limit of the 4h class interval?
В. 46
D. 48
14. Which class interval has the highest frequency?
B. 36 - 40
D. 46 - 50
Read the following statement carefully. Write the letter of the best answer on the space provided before each number.
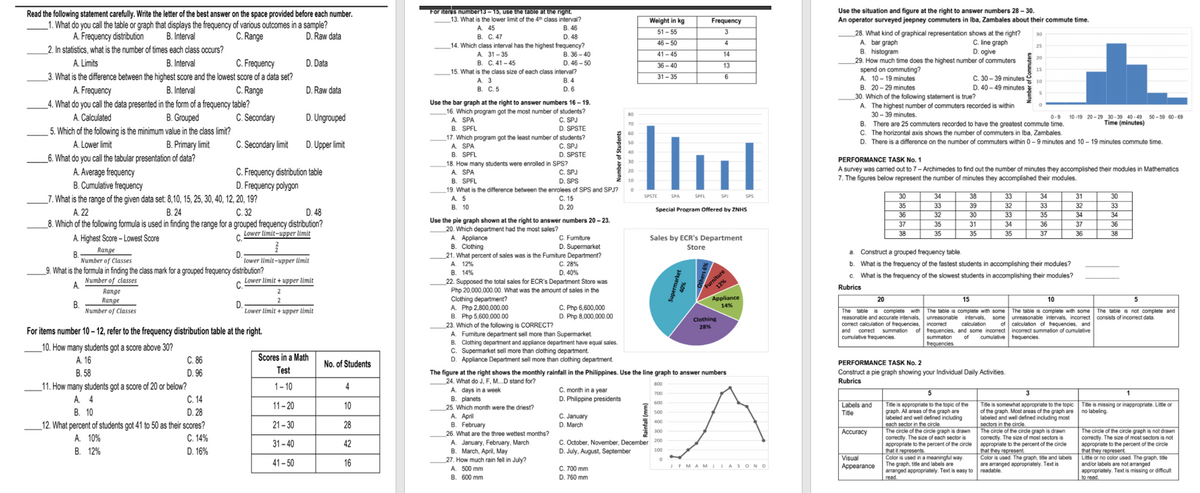
Use the situation and figure at the right to answer numbers 28 - 30.
An operator surveyed jeepney commuters in Iba, Zambales about their commute time.
Weight in kg
Frequency
_1. What do you call the table or graph that displays the frequency of various outcomes in a sample?
A. Frequency distribution
2. In statistics, what is the number of times each class occurs?
A. 45
В. С. 47
B. Interval
51- 55
3
28. What kind of graphical representation shows at the right?
A. bar graph
B. histogram
29. How much time does the highest number of commuters
spend on commuting?
A. 10- 19 minutes
C. Range
D. Raw data
30
C. ine graph
D. ogive
46 - 50
4
25
A. 31 - 35
В. С. 41 -45
41-45
14
20
A. Limits
B. Interval
C. Frequency
D. Data
36 - 40
13
15
15. What is the class size of each class interval?
3. What is the difference between the highest score and the lowest score of a data set?
C. 30 – 39 minutes
10
D. 40 - 49 minutes
31 - 35
6
A. 3
В. С.5
В.4
C. Range
B. 20- 29 minutes
A. Frequency
4. What do you call the data presented in the form of a frequency table?
B. Interval
D. Raw data
D. 6
30. Which of the following statement is true?
A. The highest number of commuters recorded is within
30 – 39 minutes.
Use the bar graph at the right to answer numbers 16 - 19.
16. Which program got the most number of students?
A. SPA
B. SPFL
17. Which program got the least number of students?
A. SPA
B. SPFL
18. How many students were enrolled in SPS?
A. SPA
B. SPFL
19. What is the difference between the enrolees of SPS and SPJ?
A. Calculated
B. Grouped
C. Secondary
D. Ungrouped
C. SPJ
D. SPSTE
0-9 10-19 20 - 29 30 -39 40 - 49 50 - 59 60 - 69
Time (minutes)
B. There are 25 commuters recorded to have the greatest commute time.
C. The horizontal axis shows the number of commuters in Iba, Zambales.
D. There is a difference on the number of commuters within 0-9 minutes and 10 - 19 minutes commute time.
5. Which of the following is the minimum value in the class limit?
A. Lower limit
B. Primary limit
C. Secondary limit
D. Upper limit
C. SPJ
D. SPSTE
40
_6. What do you call the tabular presentation of data?
A. Average frequency
B. Cumulative frequency
_7. What is the range of the given data set: 8,10, 15, 25, 30, 40, 12, 20, 19?
PERFORMANCE TASK No. 1
30
C. Frequency distribution table
D. Frequency polygon
C. SPJ
D. SPS
A survey was carried out to 7-Archimedes to find out the number of minutes they accomplished their modules in Mathematics
7. The figures below represent the number of minutes they accomplished their modules.
20
10
30
35
36
37
38
34
38
33
34
31
30
SPSTE
SPA
SPFL
SPI
SPS
C. 15
D. 20
A. 5
В. 10
33
32
32
34
39
33
33
В. 24
C. 32
A. 22
D. 48
Special Program Offered by ZNHS
32
35
35
30
33
35
34
Use the pie graph shown at the right to answer numbers 20 - 23.
20. Which department had the most sales?
A. Appliance
B. Clothing
_21. What percent of sales was is the Furniture Department?
А. 12%
В. 14%
22. Supposed the total sales for ECR's Department Store was
Php 20,000,000.00. What was the amount of sales in the
Clothing department?
A. Php 2,800,000.00
B. Php 5,600,000.00
23. Which of the following is CORRECT?
A. Funiture department sell more than Supermarket.
B. Clothing department and appliance department have equal sales.
C. Supermarket sell more than clothing department.
D. Appliance Department sell more than clothing department.
_8. Which of the following formula is used in finding the range for a grouped frequency distribution?
31
34
36
37
36
Lower limit-upper limit
37
35
35
36
38
A. Highest Score - Lowest Score
C. Fumiture
D. Supermarket
C.
Sales by ECR's Department
Store
Range
a. Construct a grouped frequency table.
B.
Number of Classes
D.
Lower limit-upper limit
C. 28%
b. What is the frequency of the fastest students in accomplishing their modules?
_9. What is the formula in finding the class mark for a grouped frequency distribution?
Furniture
12%
D. 40%
c. What is the frequency of the slowest students in accomplishing their modules?
Number of classes
A.
C.
Lower limit + upper limit
Rubrics
Range
Range
Number of Classes
2
Appliance
14%
2
20
15
10
B.
D.-
`Lower limit + upper limit
C. Php 6,600,000
D. Php 8,000,000.00
The table is complete with The table is complete with some The table is complete with some The table is not complete and
reasonable and accurate intervals. unreasonable intervals, some unreasonabie intervals, incorect consists of incorrect data.
correct calculation of frequencies, incorrect
and correct summation of frequencies, and some incorrect incorect summation of cumulative
cumulative frequencies
Clothing
calculation
of calculation of frequencies, and
28%
For items number 10 – 12, refer to the frequency distribution table at the right.
summation
frequencies
of
cumulative frequencies.
10. How many students got a score above 30?
C. 86
Scores in a Math
A. 16
В. 58
_11. How many students got a score of 20 or below?
A. 4
В. 10
12. What percent of students got 41 to 50 as their scores?
No. of Students
PERFORMANCE TASK No. 2
D. 96
Test
Construct a pie graph showing your Individual Daily Activities.
The figure at the right shows the monthly rainfall in the Philippines. Use the line graph to answer numbers
24. What do J, F, M...D stand for?
A. days in a week
B. planets
25. Which month were the driest?
Rubrics
1- 10
800
4
C. month in a year
D. Philippine presidents
700
3
C. 14
C.14
600
11- 20
10
Title is appropriate to the topic of the
graph. All areas of the graph are
labeled and well defned including
each sector in the circle
The circle of the circle graph is drawn
correctly. The size of each sector is
appropriate to the percent of the circle appropriate to the percent of the circle
that it represents.
Color is used in a meaningful way
The graph, title and labels are
arranged appropriately. Text is easy to readable.
read
Labels and
Title
Title is somewhat appropriate to the topic Tite is missing or inappropriate. Little or
of the graph. Most areas of the graph are no labeing.
labeled and well defined including most
sectors in the circle.
The circle of the circle graph is drawn
correctiy. The size of most sectors is
D. 28
500
А. Аpri
B. February
C. January
D. March
400
21- 30
28
The circle of the circle graph is not drawn
correctly. The size of most sectors is not
appropriate to the percent of the circle
that they represent
Litte or no color used. The graph, tidle
andlor labels are not arranged
appropriately. Text is missing or difficult
to read.
26. What are the three wettest months?
300
Accuracy
A. 10%
C. 14%
A. January, February, March
B. March, April, May
27. How much rain fell in July?
A. 500 mm
B. 600 mm
C. October, November, December 200
D. July, August, September
31 - 40
42
В. 12%
D. 16%
that they represent.
Color is used. The graph, tite and labels
are arranged appropriately. Text is
100
Visual
41– 50
16
C. 700 mm
JFMAM IIA SOND
Appearance
D. 760 mm
Expert Solution
This question has been solved!
Explore an expertly crafted, step-by-step solution for a thorough understanding of key concepts.
Need a deep-dive on the concept behind this application? Look no further. Learn more about this topic, statistics and related others by exploring similar questions and additional content below.