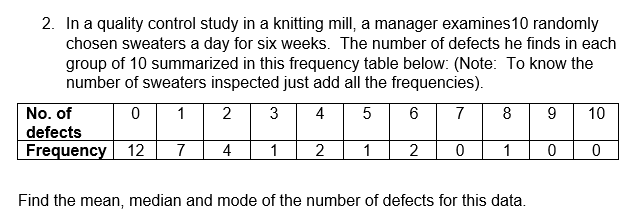
2. In a quality control study in a knitting mill, a manager examines 10 randomly chosen sweaters a day for six weeks. The number of defects he finds in each group of 10 summarized in this frequency table below: (Note: To know the number of sweaters inspected just add all the frequencies). No. of 0 1 2 3 4 5 6 7 8 9 10 defects Frequency 12 7 4 1 2 1 2 0 1 0 0 Find the mean, median and mode of the number of defects for this data.
2. In a quality control study in a knitting mill, a manager examines 10 randomly chosen sweaters a day for six weeks. The number of defects he finds in each group of 10 summarized in this frequency table below: (Note: To know the number of sweaters inspected just add all the frequencies). No. of 0 1 2 3 4 5 6 7 8 9 10 defects Frequency 12 7 4 1 2 1 2 0 1 0 0 Find the mean, median and mode of the number of defects for this data.

Glencoe Algebra 1, Student Edition, 9780079039897, 0079039898, 2018
18th Edition
ISBN:9780079039897
Author:Carter
Publisher:Carter
Chapter10: Statistics
Section10.6: Summarizing Categorical Data
Problem 4BGP

Related questions
Question
Transcribed Image Text:2. In a quality control study in a knitting mill, a manager examines 10 randomly
chosen sweaters a day for six weeks. The number of defects he finds in each
group of 10 summarized in this frequency table below: (Note: To know the
number of sweaters inspected just add all the frequencies).
No. of
0
1
2 3
4
5
6
7
8
9
10
defects
Frequency
12 7 4 1 2 1 2 0 1
0
0
Find the mean, median and mode of the number of defects for this data.
Expert Solution
This question has been solved!
Explore an expertly crafted, step-by-step solution for a thorough understanding of key concepts.

Step by step
Solved in 4 steps

Recommended textbooks for you
Glencoe Algebra 1, Student Edition, 9780079039897…
Algebra
ISBN:
9780079039897
Author:
Carter
Publisher:
McGraw Hill
Glencoe Algebra 1, Student Edition, 9780079039897…
Algebra
ISBN:
9780079039897
Author:
Carter
Publisher:
McGraw Hill