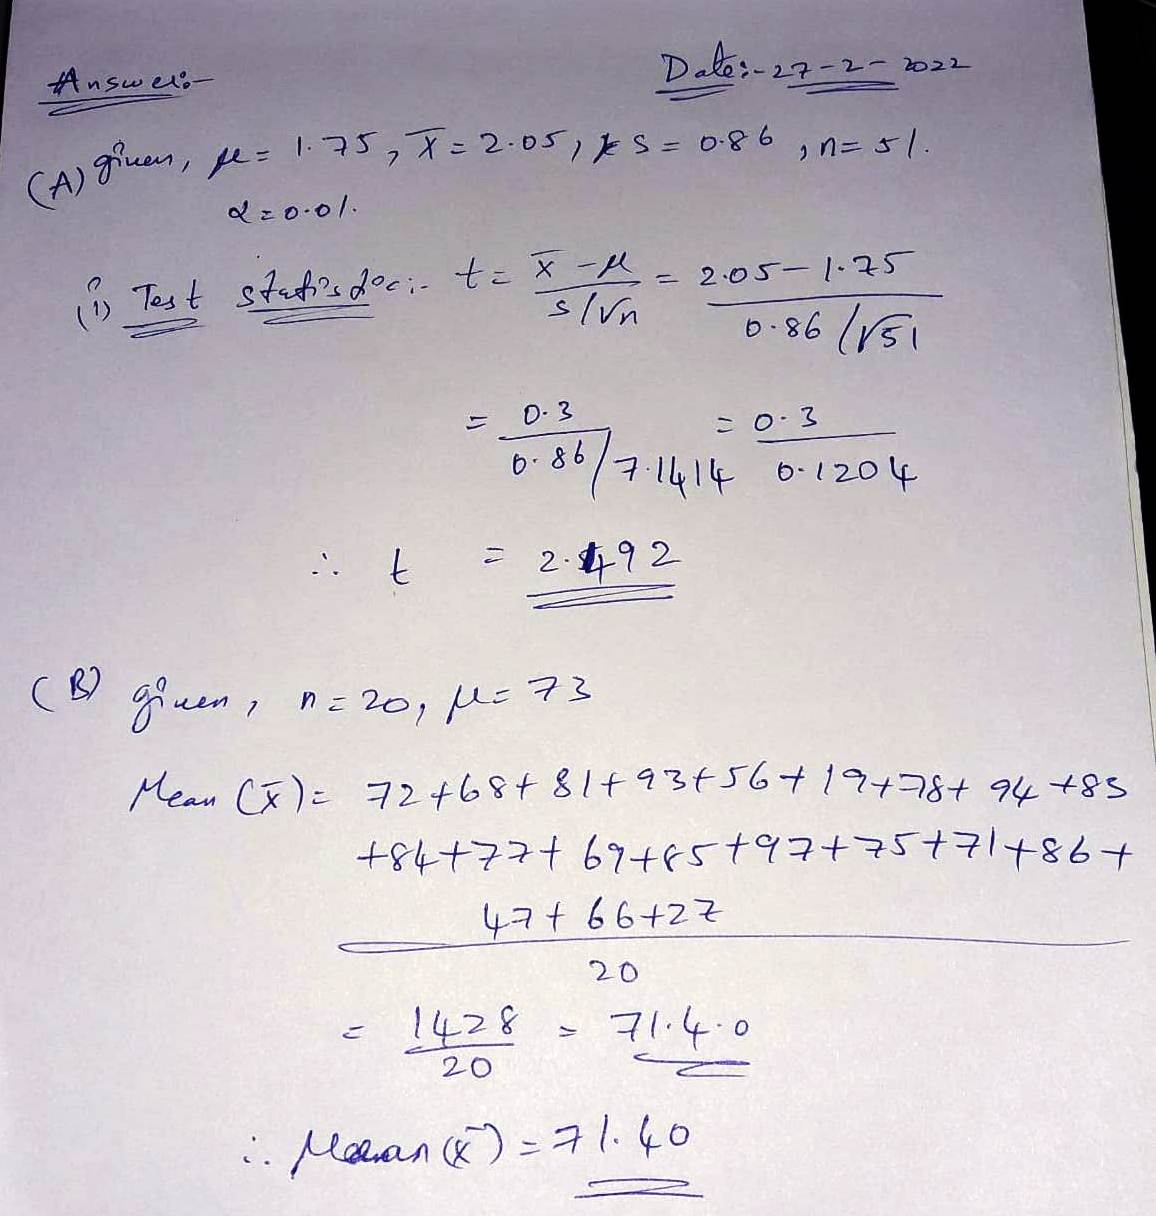
(A) A random sample of 51 adult coyotes in a region of northern Minnesota showed the average age to be x = 2.05 years, with sample standard deviation s = 0.86 years. However, it is thought that the overall population mean age of coyotes is ? = 1.75. Do the sample data indicate that coyotes in this region of northern Minnesota tend to live longer than the average of 1.75 years? Use ? = 0.01. i-What is the value of the sample test statistic? (Round your answer to three decimal places.) (B)A national newspaper reported that the state with the longest mean life span is Hawaii, where the population mean life span is 73 years. A random sample of 20 obituary notices in the Honolulu Advertizer gave the following information about life span (in years) of Honolulu residents.Use a calculator with sample mean and standard deviation keys to find x and s. (Round your answers to two decimal places.) 72 68 81 93 56 19 78 94 83 84 77 69 85 97 75 71 86 47 66 27 (i) What is the value of the sample test statistic? (Round your answer to three decimal places.)


(A) A random sample of 51 adult coyotes in a region of northern Minnesota showed the average age to be x = 2.05 years, with sample standard deviation s = 0.86 years. However, it is thought that the overall population mean age of coyotes is ? = 1.75. Do the sample data indicate that coyotes in this region of northern Minnesota tend to live longer than the average of 1.75 years? Use ? = 0.01.
i-What is the value of the sample test statistic? (Round your answer to three decimal places.)
(B)A national newspaper reported that the state with the longest mean life span is Hawaii, where the population mean life span is 73 years. A random sample of 20 obituary notices in the Honolulu Advertizer gave the following information about life span (in years) of Honolulu residents.Use a calculator with sample mean and standard deviation keys to find x and s. (Round your answers to two decimal places.)
| 72 | 68 | 81 | 93 | 56 | 19 | 78 | 94 | 83 | 84 |
| 77 | 69 | 85 | 97 | 75 | 71 | 86 | 47 | 66 | 27 |
(i) What is the value of the sample test statistic? (Round your answer to three decimal places.)

Step by step
Solved in 2 steps with 2 images


