(a) (b) (c) (d) Data on quarterly electricity sales revenue (in million £) of an electricity company during a period of 6 years from 2017 to 2022 are given below. Quarter 1 2 3 4 2017 172 227 310 222 2018 169 218 309 209 2019 182 218 313 224 2020 169 245 299 221 2021 179 235 292 213 2022 170 241 307 217 Draw a time series plot and comment on any noticeable patterns in the series. Suggest an appropriate time series model for the data, giving your reasons for choosing this model. Describe your model and obtain estimates of the components of the model using the decomposition method. You may use Excel in your calculations, but must hand in a clear readable version of your worksheet output and the formulae. Using your model forecast the company's sales for the four quarters of 2023. Show clearly your calculations. What can be said about the expected accuracy of your forecast? On the basis of your model in part (b), compare and contrast the decomposition method with the exponential smoothing method in time series analysis. You are not required to do any calculations for this part.
(a) (b) (c) (d) Data on quarterly electricity sales revenue (in million £) of an electricity company during a period of 6 years from 2017 to 2022 are given below. Quarter 1 2 3 4 2017 172 227 310 222 2018 169 218 309 209 2019 182 218 313 224 2020 169 245 299 221 2021 179 235 292 213 2022 170 241 307 217 Draw a time series plot and comment on any noticeable patterns in the series. Suggest an appropriate time series model for the data, giving your reasons for choosing this model. Describe your model and obtain estimates of the components of the model using the decomposition method. You may use Excel in your calculations, but must hand in a clear readable version of your worksheet output and the formulae. Using your model forecast the company's sales for the four quarters of 2023. Show clearly your calculations. What can be said about the expected accuracy of your forecast? On the basis of your model in part (b), compare and contrast the decomposition method with the exponential smoothing method in time series analysis. You are not required to do any calculations for this part.

Algebra & Trigonometry with Analytic Geometry
13th Edition
ISBN:9781133382119
Author:Swokowski
Publisher:Swokowski
Chapter10: Sequences, Series, And Probability
Section10.2: Arithmetic Sequences
Problem 67E

Related questions
Question
Transcribed Image Text:(a)
(b)
(c)
(d)
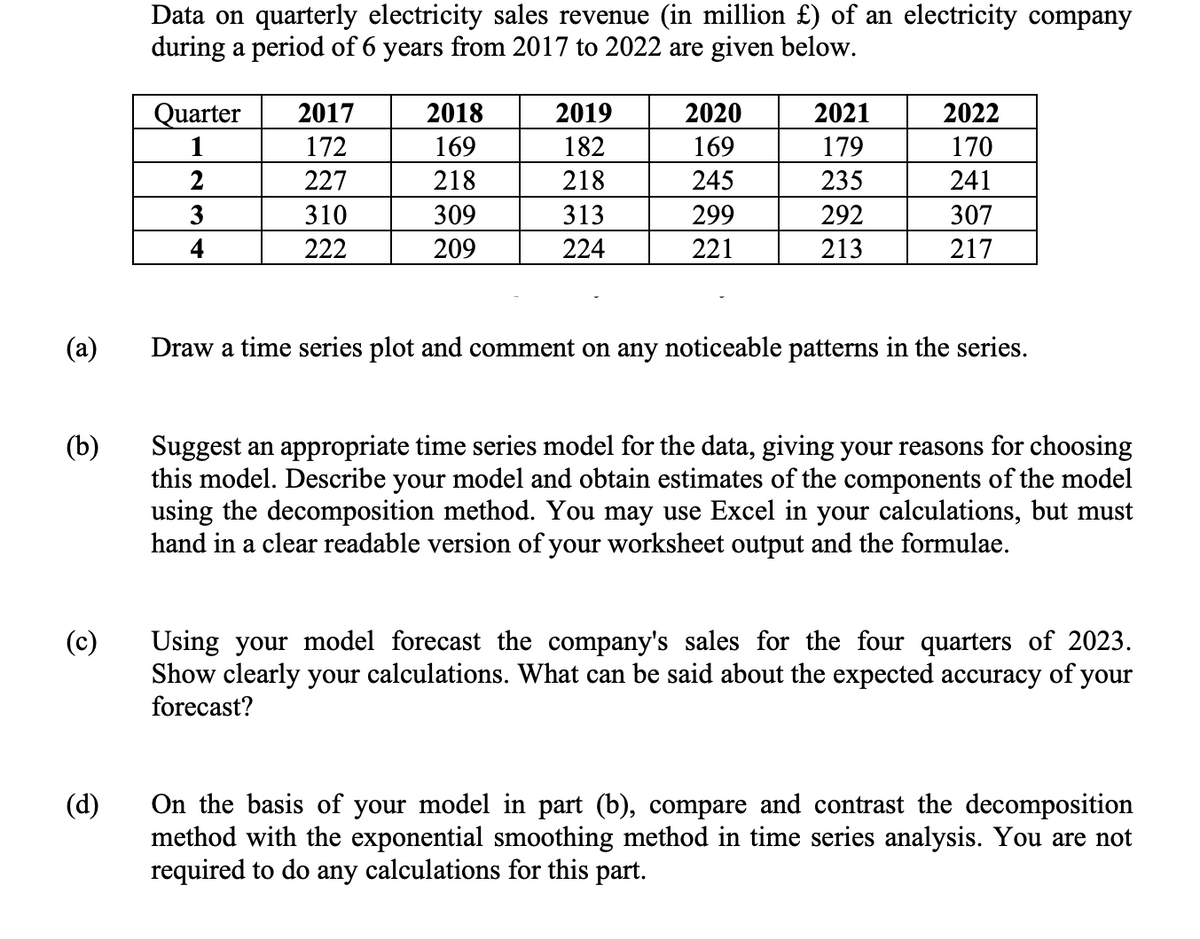
Data on quarterly electricity sales revenue (in million £) of an electricity company
during a period of 6 years from 2017 to 2022 are given below.
Quarter
1
2
3
4
2017
172
227
310
222
2018
169
218
309
209
2019
182
218
313
224
2020
169
245
299
221
2021
179
235
292
213
2022
170
241
307
217
Draw a time series plot and comment on any noticeable patterns in the series.
Suggest an appropriate time series model for the data, giving your reasons for choosing
this model. Describe your model and obtain estimates of the components of the model
using the decomposition method. You may use Excel in your calculations, but must
hand in a clear readable version of your worksheet output and the formulae.
Using your model forecast the company's sales for the four quarters of 2023.
Show clearly your calculations. What can be said about the expected accuracy of your
forecast?
On the basis of your model in part (b), compare and contrast the decomposition
method with the exponential smoothing method in time series analysis. You are not
required to do any calculations for this part.
Expert Solution
This question has been solved!
Explore an expertly crafted, step-by-step solution for a thorough understanding of key concepts.

Step by step
Solved in 6 steps with 4 images

Recommended textbooks for you
Algebra & Trigonometry with Analytic Geometry
Algebra
ISBN:
9781133382119
Author:
Swokowski
Publisher:
Cengage

Linear Algebra: A Modern Introduction
Algebra
ISBN:
9781285463247
Author:
David Poole
Publisher:
Cengage Learning
Algebra & Trigonometry with Analytic Geometry
Algebra
ISBN:
9781133382119
Author:
Swokowski
Publisher:
Cengage
Linear Algebra: A Modern Introduction
Algebra
ISBN:
9781285463247
Author:
David Poole
Publisher:
Cengage Learning