a)₁ b.' c.[ 5 0.03 10.01 0.01 10 15 20 25 30 35 40 45 50 55 Miles per gallon 'dentify the shape of the distribution (right skewed, left skewed or symmetric) ¹ Find the proportion of cars with at least 25 miles per gallon. Find the proportion of cars with a gas mileage less than 25 miles per gallon
a)₁ b.' c.[ 5 0.03 10.01 0.01 10 15 20 25 30 35 40 45 50 55 Miles per gallon 'dentify the shape of the distribution (right skewed, left skewed or symmetric) ¹ Find the proportion of cars with at least 25 miles per gallon. Find the proportion of cars with a gas mileage less than 25 miles per gallon

Glencoe Algebra 1, Student Edition, 9780079039897, 0079039898, 2018
18th Edition
ISBN:9780079039897
Author:Carter
Publisher:Carter
Chapter10: Statistics
Section10.4: Distributions Of Data
Problem 19PFA

Related questions
Question
Answer all questions below show work
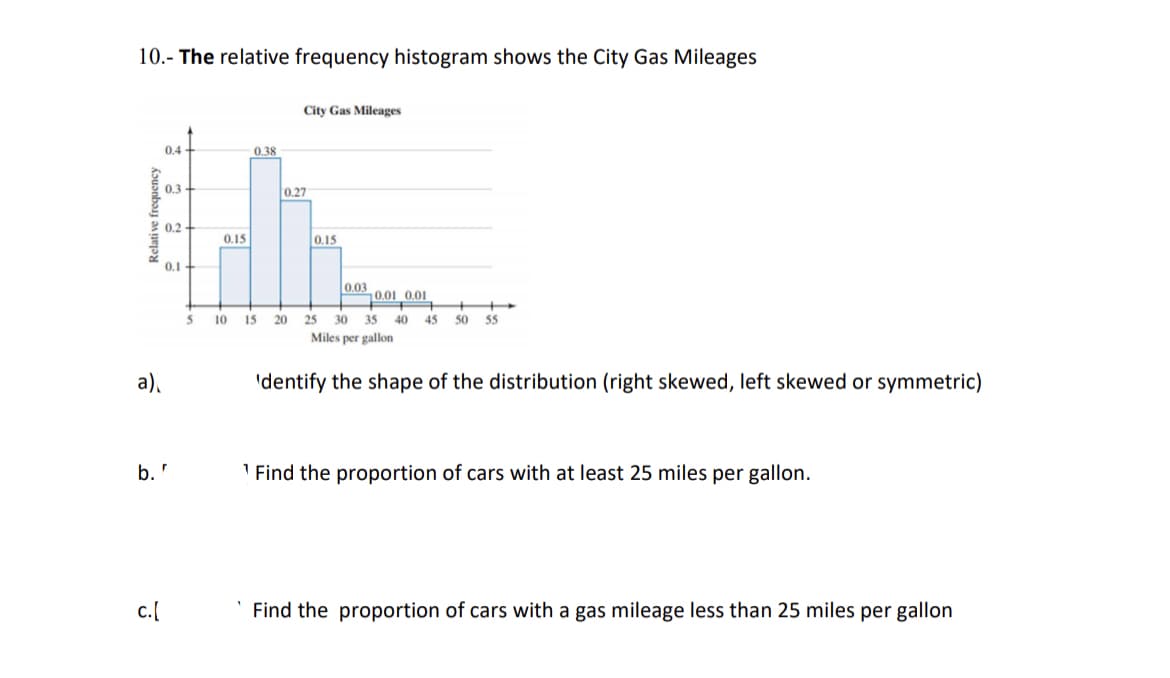
Transcribed Image Text:10.- The relative frequency histogram shows the City Gas Mileages
City Gas Mileages
0.4
0.38
0.3
0.2-
0.15
0.1
0.03
10.01 0.01
5 10 15 20 25 30 35 40 45 50 55
Miles per gallon
'dentify the shape of the distribution (right skewed, left skewed or symmetric)
Find the proportion of cars with at least 25 miles per gallon.
Find the proportion of cars with a gas mileage less than 25 miles per gallon
Relative frequency
a)
b.'
c.[
0.27
0.15
Expert Solution
This question has been solved!
Explore an expertly crafted, step-by-step solution for a thorough understanding of key concepts.

Step by step
Solved in 3 steps

Recommended textbooks for you
Glencoe Algebra 1, Student Edition, 9780079039897…
Algebra
ISBN:
9780079039897
Author:
Carter
Publisher:
McGraw Hill
Glencoe Algebra 1, Student Edition, 9780079039897…
Algebra
ISBN:
9780079039897
Author:
Carter
Publisher:
McGraw Hill