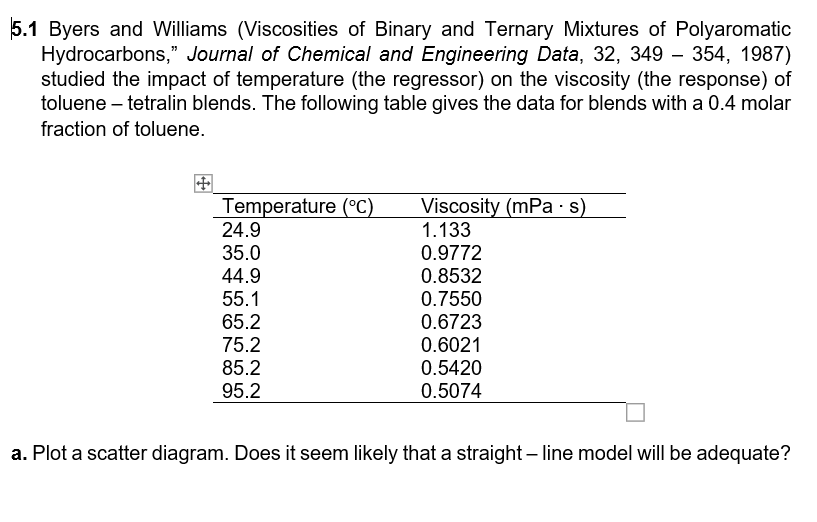
1 Byers and Williams (Viscosities of Binary and Ternary Mixtures of Polyaromatic Hydrocarbons," Journal of Chemical and Engineering Data, 32, 349 – 354, 1987) studied the impact of temperature (the regressor) on the viscosity (the response) of toluene- tetralin blends. The following table gives the data for blends with a 0.4 molar fraction of toluene. Temperature (°C) Viscosity (mPa·s) 1.133 24.9 35.0 0.9772 44.9 0.8532 55.1 0.7550 65.2 0.6723 75.2 0.6021 85.2 0.5420 95.2 0.5074 Plot a scatter diagram. Does it seem likely that a straight-line model will be adequate?
Q: STATISTICS AND PROBABILITY (Answer only. NO long explanation needed. Rate will be given) Which of…
A: We have to identify Which of the following represents this graph of a standard normal distribution?…
Q: A newspaper sports reporter has a 58% accuracy for predicting the winners in NHL hockey games. A…
A: Given that A newspaper sports reporter has a 58% accuracy for predicting the winners in NHL hockey…
Q: first class.
A: Step 1: Using the lower limit as 30 and a width of 10, make the classes.
Q: SAT Scores The national average for mathematics on a standardized test in 2011 was 519. Suppose that…
A: a) Empirical rule: The probability of the observation lies within 1 standard deviation of the mean,…
Q: II. Problem Solving (11-20) The table shows the height(x) and weight(y) of seven basketball players.…
A: The provided information is x y xy x2 y2 62 57 3534 3844 3249 63 60 3780 3969 3600 65 58…
Q: At a large university, 58% of all students live on campus. Suppose a random sample of 275 students…
A:
Q: D. The direction of the points around the line in a scatte of the variables. B. shape A. form D.…
A: 10) The direction of the points around the line in a scatterplot suggests the trend of the…
Q: Question 3 A sample of 44 commuters in Chicago showed the average of the commuting times was 33.2…
A: The following information has been given: The sample size is n=44. The sample mean is x¯=33.2. The…
Q: The daily sales at a convenience store produce a normal distribution with a mean of $1,990 and a…
A: Given problem is normal distribution. Let, X: daily sales at a convenience store product μ=mean=1990…
Q: How many outcomes are possible if you toss a coin six times?
A: Given data How many outcomes are possible if you toss a coin six times.
Q: ollowing are the numbers of hospitals in each of the 50 U.S. states plus the District of Columbia…
A: Solution To find the dot plot arrange the data in order.
Q: STATISTICS AND PROBABILITY (Answer only. NO long explanation needed. Rate will be given) TRUE OR…
A: Given that. X~N( 0 , 1 ) μ=0 , ?=1 (for standard normal distribution) Z-score =( x - μ )/?
Q: 4. A researcher knows that the average height of Filipino women is 1.53 m. A random sample of 26…
A: For the given data Perform t test for one sample mean
Q: STATISTICS AND PROBABILITY (Answer only. NO long explanation needed. Rate will be given) TRUE OR…
A:
Q: X is a random variable with mean and variance Hand o² The x-μ standardized form of X is Z= what are…
A: Given that By design and definition, Z always has a mean of 0 and a standard deviation = 1 since…
Q: For each of the following research questions, state the null and research hypotheses in words and…
A: The objective is to state the null and research hypothesis and determine the type of hypothesis test…
Q: Root_lenght Treatment Root_lenght Treatmen t control 3dS 6dS 9dS 12dS Total Case Processing Summary…
A: Box plot is used to measure the normality or skewness of the data set. Box plot calculated using the…
Q: Suppose we do not find enough evidence against the H0 below. Write the appropriate step C. N. H0:…
A: Suppose we do not find enough evidence against theH0 below. Write the appropriate step C.N. H0: μ =…
Q: A. Compute for Coefficient of r Let x ΣΥ Ξ [x² = Y n= [x = [xy = £y = r= Analysis & Interpretation…
A: Solution-: Let, X=Weight (lbs) and Y=Chest size (cm) We have following data: X Y 5.64 29.5…
Q: 2. It is known from the records of the city schools that the standard deviation of Math test scores…
A: Given : sample size, n =200 sample mean, x̄ =75 population standard deviation,σ=15…
Q: The local coffee shop keeps track of how much coffee they sell versus the temperature on that day,…
A: Given data: Sales in Php 1755 1889 1514 1438 1339 1028 Temp 20.6 22.4 24.8 27.4 28.5 31.6
Q: For safety reasons, calf dehorning has become a routine practice at dairy farms. A report from a…
A: From the provided information, Sample size (n) = 621 From which 504 dehorned calves. Level of…
Q: 7. What is the median score achieved by a student who recorded the following scores on 10 math…
A: Formula : Median= (5th observation + 6th observation) /2
Q: The local coffee shop keeps track of how much coffee they sell versus the temperature on that day,…
A:
Q: Suppose the mean blood glucose of a population of adults is 162 with a standard deviation of 58.…
A:
Q: A sample is selected from a normal population, and resulting data are as follows: 45.2, 51.5, 49.4,…
A: According to policy we supposed to answer only first three part kindly repost for remaining.
Q: Data was collected for a sample of organic snacks. The amount of sugar (in mg) in each snack is…
A:
Q: Financial analysts who make forecasts of stock prices are categorized as either "buy-side" analysts…
A: Given data Buy side analysts sell side analystsmean…
Q: Consider the three groups of seven students, where each group is subjected to one of the three…
A: Introduction: Denote μ1, μ2, μ3 as the true mean grades of students in Groups A, B, C, respectively.…
Q: The Braking Distance of 8 Volkswagen GTIs and 10 Ford Focuses were tested when traveling at 60 miles…
A: Given that 1. State the alternative hypothesis. a. Ha : μ1 < μ2 b. Ha : μ1 >…
Q: A high school teacher at a small private school assigns trigonometry practice problems to be worked…
A: For the given data Find a. Sample Mean in Minutes? b. Error in Minutes? c. Confidence Interval:…
Q: A standardized exam's scores are normally distributed. In a recent year, the mean test score was…
A:
Q: Find E[X-E[X]]]
A:
Q: A. -0.06 B. 0 C. 0.11 21. Which of the following statements about correlation is NOT correct? A.…
A: (21) We have given that, We have to check which of the following statements about correlation is…
Q: The number of planes landing in a busy airport during 10-minute intervals is thought to have a…
A: The distribution of the number of planes landing in a busy airport is given by: Number of planes…
Q: 1. Statistics and Probability students had their 50-item quiz. Given the mean score of the students…
A: The provided information is µ=35 σ=6 n=50…
Q: Provide the critical region, and t-value. 1. An educator claims that the average salary of…
A: given data : 600,560,600,550,700,550,600,850,900
Q: In a study, the sample is chosen by dividing the population into voting precincts, and sampling…
A: Explanation: Here given the question Find the what is the sampling method Finally the option d…
Q: or a sampling distribution of p with sample size n, taken out of a population of size N
A: Given that Sampling distribution of p^ Sample size = (n) Taken out from the population of size N.…
Q: A town has to choose among three candidates for mayor: A, B, or C. We want to know whether the…
A: The question is about categorical data analysis Given :
Q: 1.The National Academy of Science reported that 45% of research in mathematics is published by US…
A:
Q: Calculate Karls Pearson’s coefficient of correlation from the following data. Husband’s Age : 24…
A: Given : Husband's Age Wives Age 24 18 27 20 28 22 28 25 29 22 30 28 32 28 33 30…
Q: 100 among 600 articles are defective. If the maximum error with probability 0.99 is 0.02. Find the…
A: Given: N = 600 Number of defective article X = 100 Confidence level = 99% Margin of error E = 0.02…
Q: Scenario Much like the decision to start a business, the decision to attend college is fraught with…
A:
Q: A sample of 12 concrete specimens from supplier A were tested for their compressive strength. The…
A: Given Information: Sample A: n1=12 x¯1=85 s1=4 Sample B: n2=10 x¯2=81 s2=5
Q: d. is the other term lor test? A. Zero B. One tailed test C. Two-tailed test D. Directional 9. What…
A: It is given that the statements. Here, need to find out the correct choice for the given statements.
Q: 1. Let X be an RV with PDF a. Find the mean of X. b. Find the variance of X. f(x) = {¹ -=| - |x| for…
A:
Q: According to the National Institutes of Health, 55% of adults experience some form of lactose…
A:
Q: The number of concurrent users for some internet service provider has always averaged 3000 with a…
A: Given data: Mean = 3000 Population standard deviation = 500 Sample size = 100 Sample average = 4200…
Q: of Homogeneity of Variances df1 df2 54 oups ps 3 Sum of Squares 76 Sig. .052 ANOVA df Contrast…
A: *Answer:
Trending now
This is a popular solution!
Step by step
Solved in 2 steps with 1 images
- The article “Withdrawal Strength of Threaded Nails” (D. Rammer, S. Winistorfer, and D. Bender, Journal of Structural Engineering 2001:442–449) describes an experiment comparing the ultimate withdrawal strengths (in N/mm) for several types of nails. For an annularly threaded nail with shank diameter 3.76 mm driven into spruce-pine-fir lumber, the ultimate withdrawal strength was modeled as lognormal with μ = 3.82 and σ = 0.219. For a helically threaded nail under the same conditions, the strength was modeled as lognormal with μ = 3.47 and σ = 0.272. a) What is the mean withdrawal strength for annularly threaded nails? b) What is the mean withdrawal strength for helically threaded nails? c) For which type of nail is it more probable that the withdrawal strength will be greater than 50 N/mm? d) What is the probability that a helically threaded nail will have a greater withdrawal strength than the median for annularly threaded nails? e) An experiment is performed in which withdrawal…A study was conducted to examine if children with autism spectrum disorder (ASD) had higher prenatal exposure to air pollution, specifically particulate matter < 2.5 g in diameter (PM2.5). Researchers obtained birth records of all children born in Los Angeles between 2000 and 2008 and linked these to the Department of Developmental Services records to determine if any of those subjects had been diagnosed with ASD or not. They used the birth addresses given in the birth records to determine the average daily PM2.5 for the third trimester for each child. The standard deviation for PM2.5 among ASD subjects was found to be 34.6 and for non-ASD subjects was 16.8. Assume PM2.5 is normally distributed. 4a. What was the study design? * Randomized Clinical Trial (RCT) * Case Report * Nested Case-Control Study * Case-Control Study * cross-sectional study Cohort Study 4B. What are the null and alternative hypotheses? 4c. What type of statistical test would you use to analyze the…The article “Differences in Susceptibilities of Different Cell Lines to Bilirubin Damage” (K. Ngai, C. Yeung, and C. Leung, Journal of Paediatric Child Health, 2000:36–45) reports an investigation into the toxicity of bilirubin on several cell lines. Ten sets of human liver cells and 10 sets of mouse fibroblast cells were placed into solutions of bilirubin in albumin with a 1.4 bilirubin/albumin molar ratio for 24 hours. In the 10 sets of human liver cells, the average percentage of cells surviving was 53.9 with a standard deviation of 10.7. In the 10 sets of mouse fibroblast cells, the average percentage of cells surviving was 73.1 with a standard deviation of 9.1. Find a 98% confidence interval for the difference in survival percentages between the two cell lines.
- Q3. Kaimura et al. (2000) investigated the effects of procyanidin B-2 tonic on human hair growth after sequential use for 6 months. In one part of the study, the total hair increase (total hairs at month 6 – total hairs at month 0) in the designated scalp area was measured for a sample of 15 men treated with a placebo control and a sample of 25 men treated with a procyanidin B-2 (PB2). The data is contained in the file A2Q3.csv. (This data is simulated based on information in the paper. You must use the data in the file to carry out the analysis). Is there evidence that the total hair increase of the subjects in the procyanidin B-2 group was greater the those in the placebo control group, at the 5% level of significance? State an appropriate null and alternative hypothesis in words and symbols.A study carried out to investigate the distribution of totalbraking time (reaction time plus accelerator-to-brake movementtime, in ms) during real driving conditions at 60 km/hr gave the following summary information on the distributionof times (“A Field Study on Braking ResponsesDuring Driving,” Ergonomics, 1995: 1903–1910):mean 5 535 median 5 500 mode 5 500sd 5 96 minimum 5 220 maximum 5 9255th percentile 5 400 10th percentile 5 43090th percentile 5 640 95th percentile 5 720What can you conclude about the shape of a histogramof this data? Explain your reasoning.Test the hypothesis that the average weekly allowance of female and male ACC 215 students the same, at 5%l evel of significance. Weekly Allowance of Students (Php) Male: 1500 2000 2500 2500 2000 1750 2000 1800 Female:1500 2000 1750 1500 2000 2500 3000 3500 Ho: Ha: α = Decision Rule: Computation: Decision: Conclusion:
- Recent publications have addressed the growing concern in the scientific community around the increased prevalence of CAT scans in children between the ages of 7-18 and the growing rate of childhood cancers. Suppose the researcher plans to gather a SRS from a group of children in this age range who have received one or more CAT scans, and a SRS from a group of children who have never received a CAT scan and compare the number of cases of childhood cancers that develop over a prolonged period of time. Assume the following table summarizes the descriptive statistics for his samples. Population Average cases of childhood cancers Standard deviaton Sample size >CAT scan 24.6 2.4 1,894 No CAT scans 11.4 1.9 2,745 A) Carry out the appropriate statistical test to answer the researcher’s hypothesis regarding the difference in average cases of childhood cancers in children aged 7-18 receiving one or more CAT scans versus those that have never received a CAT scan. Use an alpha level…Suppose a researcher is interested inthe effectiveness in a new childhood exercise program implemented in a SRS of schools across a particular county. In order to test the hypothesis that the new program decreases BMI (Kg/m2), the researcher takes a SRS of children from schools where the program is employed and a SRS from schools that do not employ the program and compares the results. Assume the following table represents the SRSs of students and their BMIs. Student intervention group BMI (kg/m2) Student control group BMI (kg/m2) A 18.6 A 21.6 B 18.2 B 18.9 C 19.5 C 19.4 D 18.9 D 22.6 E 24.1 F 23.6 A) Assuming that all the necessary conditions are met (normality, independence, etc.) carry out the appropriate statistical test to determine if the new exercise program is effective. Use an alpha level of 0.05. Do not assume equal variances.B) Construct a 95% confidence interval about your estimate for the average difference in BMI between the groups.A cohort study is conducted to assess the association between clinical characteristics and the risk of stroke. The study involves n=1,250 participants who are free of stroke at the study start. Each participant is assessed at study start (baseline) and every year thereafter for five years. The following table displays data on hypertensive status measured at baseline and incident stroke over 5 years. Free of Stroke at 5 Years Stroke Baseline: Not Hypertensive 952 46 Baseline: Hypertensive 234 18 Compute the population attributable risk of stroke for patients with hypertension.
- A researcher wanted to determine if carpeted rooms contain more bacteria than uncarpeted rooms. The table shows the results for the number of bacteria per cubic foot for both types of rooms. Full data set Carpeted Uncarpeted 7.5 14.9 9.4 5.1 10.6 4.2 9.2 12.7 9.9 13.3 9.3 4.2 6.9 11.1 7.5 12.5 Determine whether carpeted rooms have more bacteria than uncarpeted rooms at the α=0.05 level of significance. Normal probability plots indicate that the data are approximately normal and boxplots indicate that there are no outliers. State the null and alternative hypotheses. Let population 1 be carpeted rooms and population 2 be uncarpeted rooms. A. H0: μ1=μ2 H1: μ1>μ2 This is the correct answer. B. H0: μ1<μ2 H1: μ1>μ2 C. H0: μ1=μ2 H1: μ1≠μ2 D. H0: μ1=μ2 H1: μ1<μ2 Your answer is not correct. Determine the P-value for this hypothesis test. P-value=nothing…Listed below are amounts of strontium-90 (in millibecquerels, or mBq, per gram of calcium) in a simple random sample by baby teeth obtained from Pennsylvania residents and New York residents born after 1979. Use a 0.05 significance level and Wilcoxon rank-sum test to test the claim that the median amount of strontium-90 from Pennsylvania residents is the same as the median from New York residents. Pennsylvania 155 142 149 130 151 163 151 142 156 133 138 161 New York 133 140 142 131 134 129 128 140 140 140 137 143 1. what is the exact value of R = R 1 (Pennsylvania)? (Round off to 1 decimal place.) 2. what is the value of μ R ? (Type as a whole number.) 3. what is the value of σ R ? (Round off to 2 decimal places.) 4. what is the computed value of z ? (Round off to 2 decimal places.) 5. what is the tabular value of z ? (Round off to 2 decimal places.Seedlings of understory trees in mature tropical rainforests must survive and grow using inter- mittent flecks of sunlight. How does the length of exposure to these flecks of sunlight (fleck duration) affect growth? Leakey et al. (2005) experimentally irradiated seedlings of the Southeast Asian rainforest tree Shorea leprosula with flecks of light of varying duration while maintaining the same total irradiance to all the seedlings. Their data for 21 seedlings are listed in the following table. i. What is the rate of change in relative growth rate per minute of fleck duration? provide a standard error for your estimate. ii. using these data, test the hypothesis that fleck duration affects seedling growth rate. iii. Calculate a 99% confidence interval for the slope of the population regression.