= a + bt+c₁D₁ + C₂D₂ + c3D3 d quarterly sales data for 2004/2021/V (t = 1, ..., 64) for an appliance manufacturer to obt are dummy variables for quarters I, II, and III. DEPENDENT VARIABLE: QT R-SQUARE F-RATIO P-VALUE ON F OBSERVATIONS: 64 0.8768 107.982 0.0001 PARAMETER STANDARD ESTIMATE ERROR T-RATIO P-VALUE VARIABLE INTERCEPT 30.0 12.80 2.34 0.0224 T 1.5 0.70 2.14 0.0362 10 a 00 22 0 0015
= a + bt+c₁D₁ + C₂D₂ + c3D3 d quarterly sales data for 2004/2021/V (t = 1, ..., 64) for an appliance manufacturer to obt are dummy variables for quarters I, II, and III. DEPENDENT VARIABLE: QT R-SQUARE F-RATIO P-VALUE ON F OBSERVATIONS: 64 0.8768 107.982 0.0001 PARAMETER STANDARD ESTIMATE ERROR T-RATIO P-VALUE VARIABLE INTERCEPT 30.0 12.80 2.34 0.0224 T 1.5 0.70 2.14 0.0362 10 a 00 22 0 0015

Functions and Change: A Modeling Approach to College Algebra (MindTap Course List)
6th Edition
ISBN:9781337111348
Author:Bruce Crauder, Benny Evans, Alan Noell
Publisher:Bruce Crauder, Benny Evans, Alan Noell
Chapter5: A Survey Of Other Common Functions
Section5.6: Higher-degree Polynomials And Rational Functions
Problem 1TU: The following fictitious table shows kryptonite price, in dollar per gram, t years after 2006. t=...

Related questions
Question
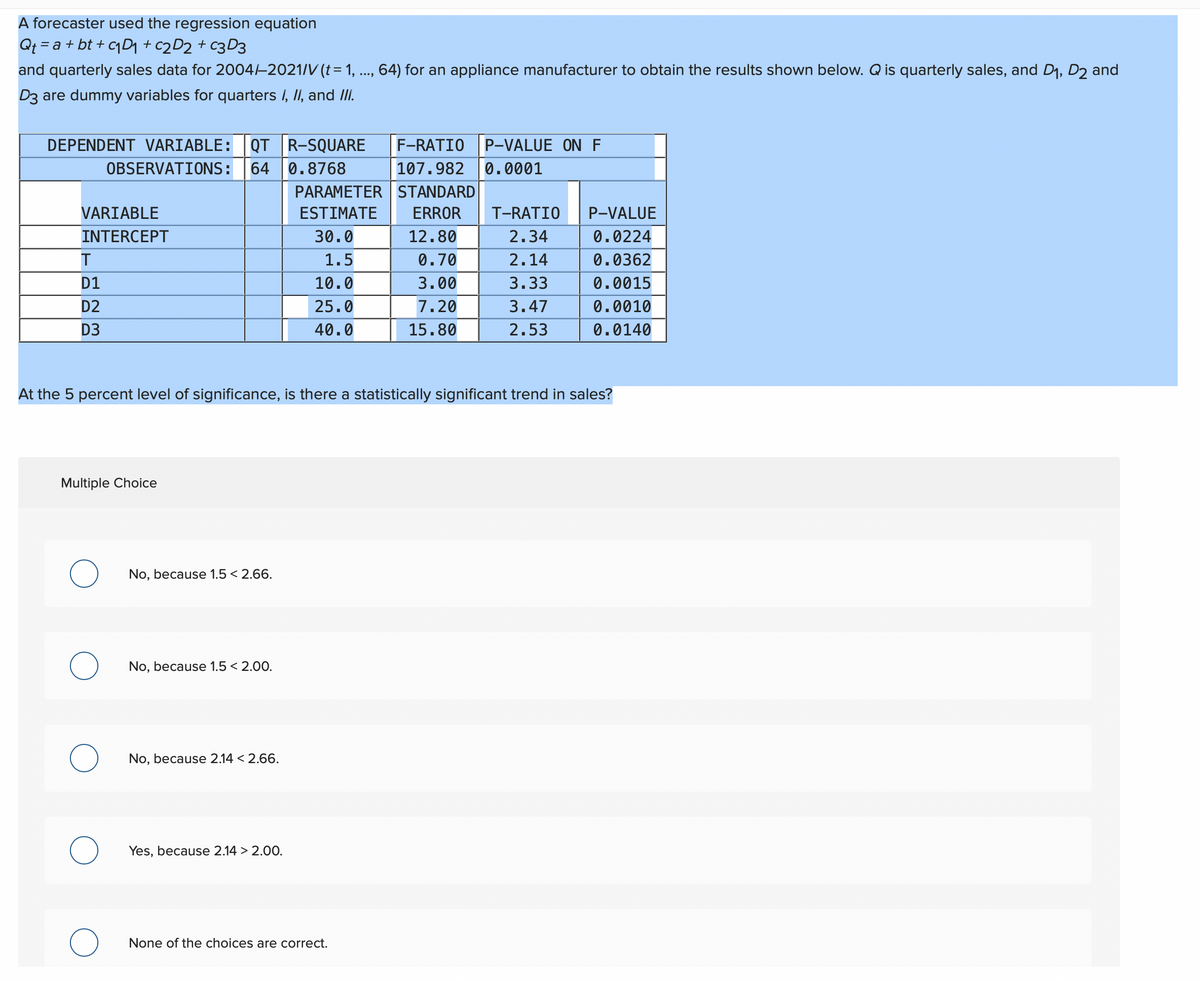
Transcribed Image Text:A forecaster used the regression equation
Qt = a + bt+c₁D₁ + C2D2 + c3D3
and quarterly sales data for 2004/2021/V (t = 1, ..., 64) for an appliance manufacturer to obtain the results shown below. Q is quarterly sales, and D₁, D2 and
D3 are dummy variables for quarters I, II, and III.
DEPENDENT VARIABLE: QT R-SQUARE
F-RATIO P-VALUE ON F
OBSERVATIONS:
64 0.8768
107.982 0.0001
PARAMETER
STANDARD
VARIABLE
ESTIMATE
ERROR T-RATIO P-VALUE
INTERCEPT
30.0
12.80
2.34
0.0224
T
1.5
0.70
2.14
0.0362
D1
10.0
3.00
3.33
0.0015
D2
25.0
7.20
3.47
0.0010
D3
40.0
15.80
2.53
0.0140
At the 5 percent level of significance, is there a statistically significant trend in sales?
Multiple Choice
No, because 1.5 < 2.66.
No, because 1.5 < 2.00.
No, because 2.14 < 2.66.
Yes, because 2.14 > 2.00.
None of the choices are correct.
O
O
O
Expert Solution
This question has been solved!
Explore an expertly crafted, step-by-step solution for a thorough understanding of key concepts.

This is a popular solution!

Trending now
This is a popular solution!

Step by step
Solved in 3 steps with 1 images

Recommended textbooks for you
Functions and Change: A Modeling Approach to Coll…
Algebra
ISBN:
9781337111348
Author:
Bruce Crauder, Benny Evans, Alan Noell
Publisher:
Cengage Learning
Functions and Change: A Modeling Approach to Coll…
Algebra
ISBN:
9781337111348
Author:
Bruce Crauder, Benny Evans, Alan Noell
Publisher:
Cengage Learning