a) Calculate sample size, mean, SD for each group x1 (Survived) and x2 (Not survived). b) Let us denote μ1= mean for x1 (Survived) and μ2 = mean for x2 (Not survived). Calculate 95% confidence intervals for each μ1 and μ2. c) Calculate 95% confidence intervals for the difference of means μ1 − μ2. d) Do the test of the hypothesis H0 : μ1 = μ2 vs H1 : μ1 ≠ μ2. Use the significance level α = 0.05. e) Do the test of the hypothesis H0 : μ1 = μ2 vs H1 : μ1 < μ2. Use the significance level α = 0.01. f) Find β and the power of the test for the hypothesis H0 : μ1 − μ2 = 0 vs H1 : μ1 − μ2 = −3. at the significance level α = 0.01.


a) Calculate sample size,
b) Let us denote μ1= mean for x1 (Survived) and μ2 = mean for x2 (Not survived). Calculate 95% confidence intervals for each μ1 and μ2.
c) Calculate 95% confidence intervals for the difference of means μ1 − μ2.
d) Do the test of the hypothesis
H0 : μ1 = μ2 vs H1 : μ1 ≠ μ2.
Use the significance level α = 0.05.
e) Do the test of the hypothesis
H0 : μ1 = μ2 vs H1 : μ1 < μ2.
Use the significance level α = 0.01.
f) Find β and the power of the test for the hypothesis
H0 : μ1 − μ2 = 0 vs H1 : μ1 − μ2 = −3.
at the significance level α = 0.01.
![Q1.
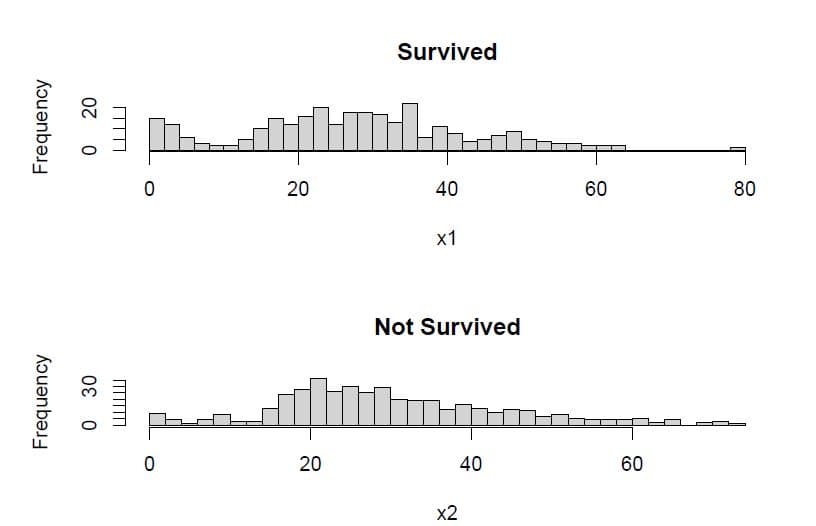
Use the following R code to create the data and plot of Age by Survided. We will compare mean age of
survived and non-survived group.
library(ggplot2)
library (dplyr)
library (tidyr)
library(titanic)
titanicData <- drop_na (titanic_train)
head (titanicData)
PassengerId Survived Pclass
## 1
1
## 2
2
1
1
## 3
3
1
3
## 4
4
1
## 5
5
3
## 6
7
1
##
Name
Sex Age SibSp Parch
## 1
Braund, Mr. Owen Harris
male 22
1
## 2 Cumings, Mrs. John Bradley (Florence Briggs Thayer) female 38
Heikkinen, Miss. Laina female 26
1
## 3
Futrelle, Mrs. Jacques Heath (Lily May Peel) female 35
Allen, Mr. William Henry
McCarthy, Mr. Timothy J
## 4
1
## 5
male 35
## 6
male 54
##
Ticket
Fare Cabin Embarked
## 1
A/5 21171 7.2500
S
## 2
PC 17599 71.2833
C85
## 3 STON/02. 3101282 7.9250
S
## 4
113803 53.1000 C123
S
## 5
373450 8.0500
S
## 6
17463 51.8625
E46
x1 <- titanicData$Age [titanicData$Survived=31]
x2 <- titanicData$Age [titanicData$Survived==0]
par (mfrow=c (2,1))
hist (x1, main="Survived", breaks=30)
hist (x2, main="Not Survived" , breaks=30)](/v2/_next/image?url=https%3A%2F%2Fcontent.bartleby.com%2Fqna-images%2Fquestion%2Fba18de34-fc06-47a6-b1ea-c54726b84874%2F2e3f7359-7efd-401e-91fe-ca400bc6482c%2Fzaheemo_processed.jpeg&w=3840&q=75)


Trending now
This is a popular solution!

Step by step
Solved in 4 steps with 2 images

Please do the remaining questions
d) Do the test of the hypothesis
H0 : μ1 = μ2 vs H1 : μ1 ≠ μ2.
Use the significance level α = 0.05.
e) Do the test of the hypothesis
H0 : μ1 = μ2 vs H1 : μ1 < μ2.
Use the significance level α = 0.01.
f) Find β and the power of the test for the hypothesis
H0 : μ1 − μ2 = 0 vs H1 : μ1 − μ2 = −3.
at the significance level α = 0.01.
![Use the following R code to create the data and plot of Age by Survided. We will compare mean age of
survived and non-survived group.
library(ggplot2)
library(dplyr)
library(tidyr)
library (titanic)
titanicData <- drop_na(titanic_train)
head (titanicData)
PassengerId Survived Pclass
3
##
## 1
## 2
1
1
## 3
## 4
1
1
## 5
3
9 ##
##
1
Sex Age SibSp Parch
male 22
Name
## 1
Braund, Mr. Owen Harris
1
## 2 Cumings, Mrs. John Bradley (Florence Briggs Thayer) female 38
Heikkinen, Miss. Laina female 26
1
## 3
Futrelle, Mrs. Jacques Heath (Lily May Peel) female 35
Allen, Mr. William Henry
McCarthy, Mr. Timothy J
## 4
1
## 5
male 35
9 ##
##
male 54
Ticket
Fare Cabin Embarked
## 1
A/5 21171 7.2500
S
## 2
PC 17599 71.2833
C85
## 3 STON/02. 3101282 7.9250
S
## 4
113803 53.1000 C123
S
## 5
373450 8.0500
S
## 6
17463 51.8625
E46
S
x1 <- titanicData$Age [titanicData$Survived=%31]
x2 <- titanicData$Age[titanicData$Survived==0]
par (mfrow=c (2,1))
hist (x1, main="Survived", breaks=30)
hist (x2, main="Not Survived" , breaks=30)
123 457](https://content.bartleby.com/qna-images/question/ba18de34-fc06-47a6-b1ea-c54726b84874/7a1a5b68-1c7c-4d77-8c52-293297451af6/7g722d_processed.png)

