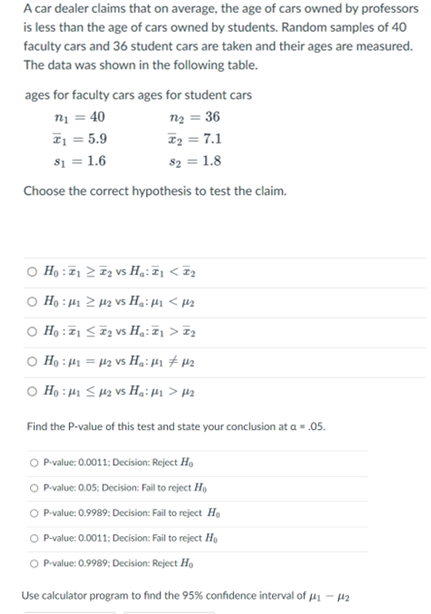
A car dealer claims that on average, the age of cars owned by professors is less than the age of cars owned by students. Random samples of 40 faculty cars and 36 student cars are taken and their ages are measured. The data was shown in the following table. ages for faculty cars ages for student cars m₁ = 40 n₂ = 36 F₁ = 5.9 F₂ = 7.1 $1 = 1.6 82 = 1.8 Choose the correct hypothesis to test the claim. Ho: ₁ ≥ ₂ vs H₂:1 < ₂ Ho : με ≥ με vs Ha: με < με O H₂:1₂ VS H₁: ₁ > ₂ Ho: 1 = μ₂ vs H₁: Mr ‡µ₂ Ho: M1 M₂ Vs Ha: 1 > ₂ Find the P-value of this test and state your conclusion at a = .05. P-value: 0.0011; Decision: Reject Ho P-value: 0.05; Decision: Fail to reject Ho O P-value: 0.9989; Decision: Fail to reject Ho O P-value: 0.0011; Decision: Fail to reject Ho P-value: 0.9989; Decision: Reject Ho Use calculator program to find the 95% confidence interval of μ1-442
A car dealer claims that on average, the age of cars owned by professors is less than the age of cars owned by students. Random samples of 40 faculty cars and 36 student cars are taken and their ages are measured. The data was shown in the following table. ages for faculty cars ages for student cars m₁ = 40 n₂ = 36 F₁ = 5.9 F₂ = 7.1 $1 = 1.6 82 = 1.8 Choose the correct hypothesis to test the claim. Ho: ₁ ≥ ₂ vs H₂:1 < ₂ Ho : με ≥ με vs Ha: με < με O H₂:1₂ VS H₁: ₁ > ₂ Ho: 1 = μ₂ vs H₁: Mr ‡µ₂ Ho: M1 M₂ Vs Ha: 1 > ₂ Find the P-value of this test and state your conclusion at a = .05. P-value: 0.0011; Decision: Reject Ho P-value: 0.05; Decision: Fail to reject Ho O P-value: 0.9989; Decision: Fail to reject Ho O P-value: 0.0011; Decision: Fail to reject Ho P-value: 0.9989; Decision: Reject Ho Use calculator program to find the 95% confidence interval of μ1-442
Glencoe Algebra 1, Student Edition, 9780079039897, 0079039898, 2018
18th Edition
ISBN:9780079039897
Author:Carter
Publisher:Carter
Chapter10: Statistics
Section10.6: Summarizing Categorical Data
Problem 10CYU
Related questions
Question

Transcribed Image Text:A car dealer claims that on average, the age of cars owned by professors
is less than the age of cars owned by students. Random samples of 40
faculty cars and 36 student cars are taken and their ages are measured.
The data was shown in the following table.
ages for faculty cars ages for student cars
m₁ = 40
n₂ = 36
F₁ = 5.9
F₂ = 7.1
$1 = 1.6
82 = 1.8
Choose the correct hypothesis to test the claim.
Ho: ₁ ≥ ₂ vs H₂:1 < ₂
Ho : με ≥ με vs Ha: με < με
O H₂:1₂ VS H₁: ₁ > ₂
Ho: 1 = μ₂ vs H₁: Mr ‡µ₂
Ho: M1 M₂ Vs Ha: 1 > ₂
Find the P-value of this test and state your conclusion at a = .05.
P-value: 0.0011; Decision: Reject Ho
P-value: 0.05; Decision: Fail to reject Ho
O P-value: 0.9989; Decision: Fail to reject Ho
O P-value: 0.0011; Decision: Fail to reject Ho
P-value: 0.9989; Decision: Reject Ho
Use calculator program to find the 95% confidence interval of μ1-442
Expert Solution
This question has been solved!
Explore an expertly crafted, step-by-step solution for a thorough understanding of key concepts.
This is a popular solution!
Trending now
This is a popular solution!
Step by step
Solved in 4 steps with 3 images

Recommended textbooks for you

Glencoe Algebra 1, Student Edition, 9780079039897…
Algebra
ISBN:
9780079039897
Author:
Carter
Publisher:
McGraw Hill

Big Ideas Math A Bridge To Success Algebra 1: Stu…
Algebra
ISBN:
9781680331141
Author:
HOUGHTON MIFFLIN HARCOURT
Publisher:
Houghton Mifflin Harcourt

Holt Mcdougal Larson Pre-algebra: Student Edition…
Algebra
ISBN:
9780547587776
Author:
HOLT MCDOUGAL
Publisher:
HOLT MCDOUGAL

Glencoe Algebra 1, Student Edition, 9780079039897…
Algebra
ISBN:
9780079039897
Author:
Carter
Publisher:
McGraw Hill

Big Ideas Math A Bridge To Success Algebra 1: Stu…
Algebra
ISBN:
9781680331141
Author:
HOUGHTON MIFFLIN HARCOURT
Publisher:
Houghton Mifflin Harcourt

Holt Mcdougal Larson Pre-algebra: Student Edition…
Algebra
ISBN:
9780547587776
Author:
HOLT MCDOUGAL
Publisher:
HOLT MCDOUGAL