A CBS News poll conducted June 10 and 11, 2006, among a nationwide random sample of 651 adults, asked those adults about their party affiliation (Democrat, Republican or none) and their opinion of how the US economy was changing ("getting better," "getting worse" or "about the same"). The results are shown in the table below. Republican Democrat none better same worse 104 87 90 38 12 21 Express your answers as a decimal and round to the nearest 0.001 (in other words, type 0.123, not 12.3% or 0.123456). P(worse): If we randomly select one of the adults who participated in this study, compute: P(affiliated with neither party) = = 44 137 118 P(worse | affiliated with neither party) =
A CBS News poll conducted June 10 and 11, 2006, among a nationwide random sample of 651 adults, asked those adults about their party affiliation (Democrat, Republican or none) and their opinion of how the US economy was changing ("getting better," "getting worse" or "about the same"). The results are shown in the table below. Republican Democrat none better same worse 104 87 90 38 12 21 Express your answers as a decimal and round to the nearest 0.001 (in other words, type 0.123, not 12.3% or 0.123456). P(worse): If we randomly select one of the adults who participated in this study, compute: P(affiliated with neither party) = = 44 137 118 P(worse | affiliated with neither party) =

Chapter8: Sequences, Series,and Probability
Section8.7: Probability
Problem 4ECP: Show that the probability of drawing a club at random from a standard deck of 52 playing cards is...

Related questions
Question
100%
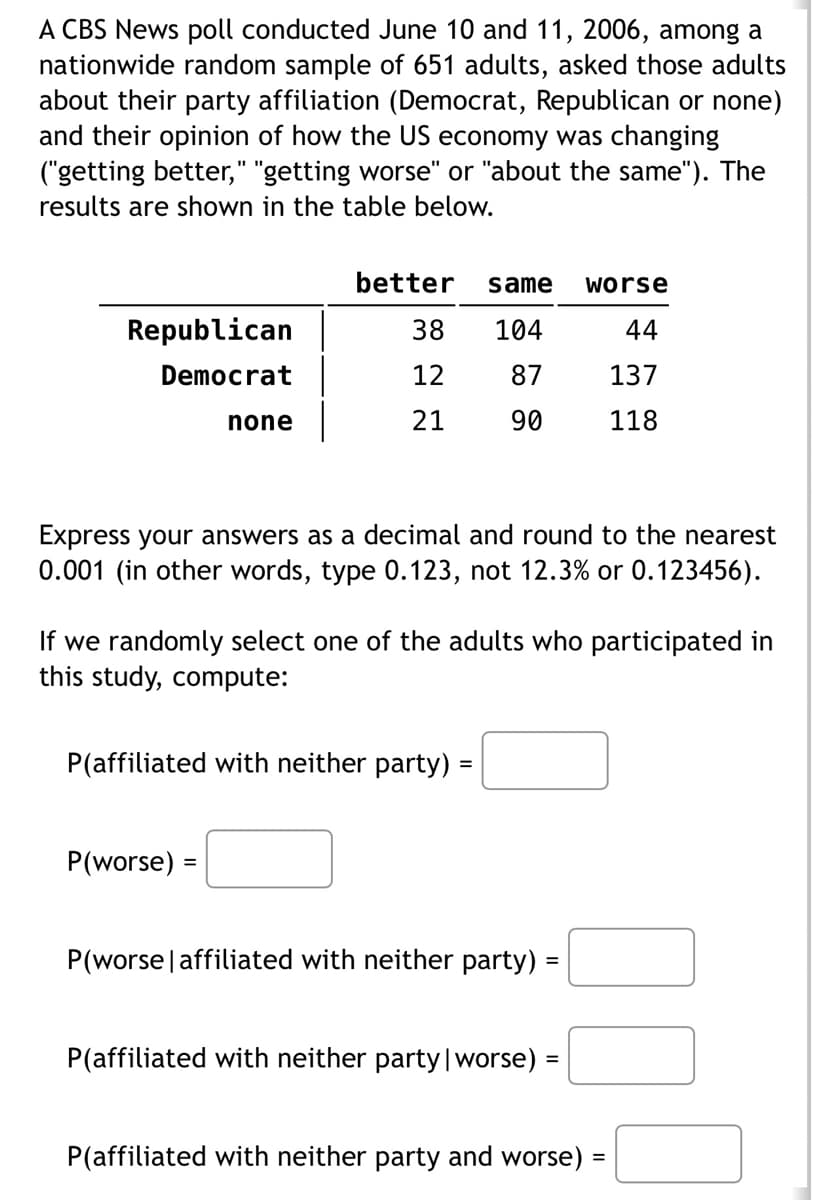
Transcribed Image Text:A CBS News poll conducted June 10 and 11, 2006, among a
nationwide random sample of 651 adults, asked those adults
about their party affiliation (Democrat, Republican or none)
and their opinion of how the US economy was changing
("getting better," "getting worse" or "about the same"). The
results are shown in the table below.
Republican
Democrat
none
better same worse
38
104
44
12 87
137
21
90
118
Express your answers as a decimal and round to the nearest
0.001 (in other words, type 0.123, not 12.3% or 0.123456).
If we randomly select one of the adults who participated in
this study, compute:
P(worse) =
P(affiliated with neither party) =
P(worse | affiliated with neither party) =
P(affiliated with neither party | worse) =
P(affiliated with neither party and worse) =
Expert Solution
This question has been solved!
Explore an expertly crafted, step-by-step solution for a thorough understanding of key concepts.

Step by step
Solved in 3 steps with 3 images

Recommended textbooks for you

Holt Mcdougal Larson Pre-algebra: Student Edition…
Algebra
ISBN:
9780547587776
Author:
HOLT MCDOUGAL
Publisher:
HOLT MCDOUGAL

Holt Mcdougal Larson Pre-algebra: Student Edition…
Algebra
ISBN:
9780547587776
Author:
HOLT MCDOUGAL
Publisher:
HOLT MCDOUGAL