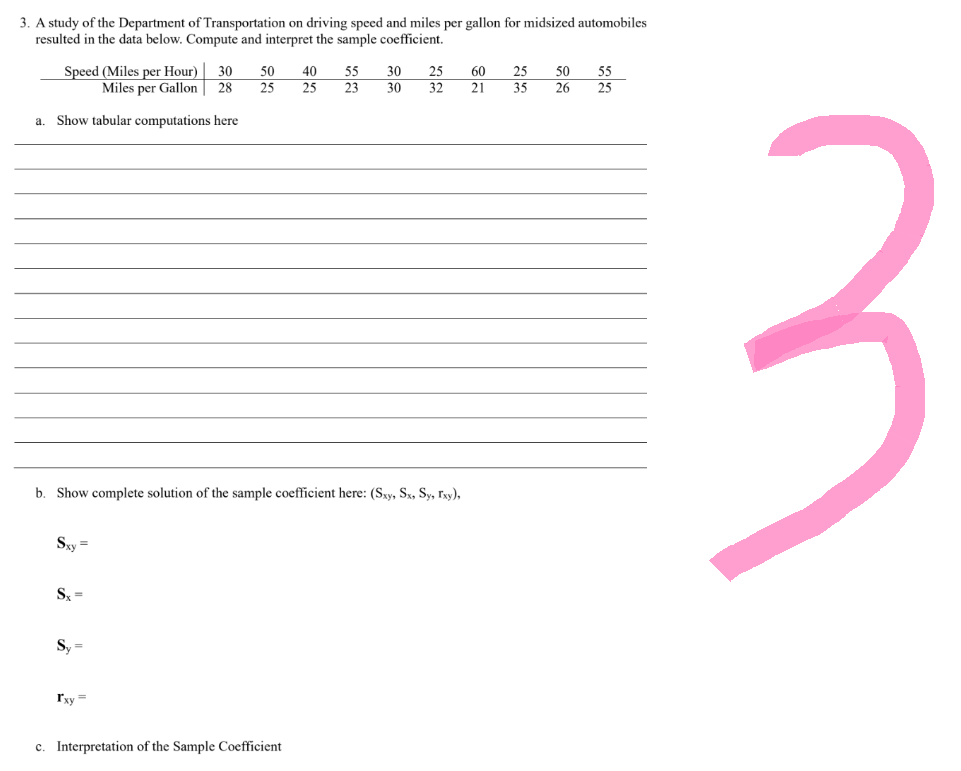
Miles per Gallon 28 25 25 23 30 32 21 a. Show tabular computations here b. Show complete solution of the sample coefficient here: (Sxy, Sx, Sy, Ixy), Sxy= Sx= I'xy c. Interpretation of the Sample Coefficient 555 35 26


Q: In a specific year, SAT scores were Normally distributed with mean 1026 and standard deviation 209;…
A:
Q: Find 24th percentile, P24, from the following data 100 120 140 170 190 210 230 290 300 320 330 350…
A: Data given…
Q: Consider a data set containing the following values: 80, 94, 93, 106, 91, 90, 96, 99 The mean of…
A: Given: n = 8 Mean = 93.625 Formula Used: Sample variance s2 = ∑Xi-X2n-1 Sample standard deviation s…
Q: pg. 60, 1.7.26*. Let F(x) = 1/3, 0 < x < 3, Zero elsewhere, be the pdf of X. Find the cdf and pdf of…
A: The probability density function of X is given as: fx=13 if 0<x<3=0 otherwise Need to…
Q: A Filipino maize breeder who is apprehensive about the low rate of adoption of new high-yielding…
A: Given information: A maize breeder is apprehensive about the low acceptance of new high yielding…
Q: Assuming you have a data matrix X that has n rows and p variables and you know both µ and Σ. How is…
A:
Q: K Assume that adults have IQ scores that are normally distributed with a mean of 97.6 and a standard…
A: Given Mean =97.6 Standard deviation =15.8 We have to calculate 1st quartile
Q: The gas mileages (in miles per gallon) for 34 cars are shown in the frequency distribution.…
A: The frequency distribution table of gas mileage is given.
Q: (a) Determine the population mean pulse. The population mean pulse is approximately (Round to one…
A: Given: Population size, N=9 Student Pulse Perceptual Bempah 86 Megan Brooks 73 Jeff…
Q: a) Name the experimental units. b) Name the response variable(s). c) Name the factor(s) or…
A: here we have to find a) Name the experimental units.b) Name the response variable(s).c) Name the…
Q: Page 44, 1.5.4*. Let px(x) be the pmf of a random variable X. Find the cdf F (x) of X and sketch its…
A:
Q: QUESTION 6 In a study concerned with the possible effects of air pollution on the development of…
A: Given: Population size N = 2200 Number of new cases = 450 Formula Used: The incidence rate per 100…
Q: 26 randomly selected students were asked the number of movies they watched the previous week. The…
A: The data shows the number of movies they watched in the previous week of 26 randomly selected…
Q: A medical test is available to determine whether a patient has a certain disease. To determine the…
A: Given information: Total number of people tested = 10100 Only 100 of these people have the…
Q: he number of students that took this c
A: The histogram is given with prealgebra exam scores and frequency in the class.
Q: The population mean (u) represents a ___? A. Parameter B. Statistic
A: we have to find population mean represents what parameter or statistics.
Q: The frequency distribution was obtained using a class width of 0.5 for data on cigarette tax rates.…
A: The frequency distribution of cigarette tax rates are given.
Q: The U.S. government provides fuel economy (in miles per gallon) and other information about late…
A: Concept: Slope represents the change in the dependent variable (I.e. Mpg) when you change the…
Q: There is a high possibility that the mode may not be defined for (Select the best answer) A.…
A: There are two types of variable they are continuous and discrete random variable. Continuous random…
Q: K The data given to the right includes data from 43 candies, and 7 of them are red. The company that…
A: It is given that Sample size n = 43 Number of red candies X = 7 Confidence level = 90%
Q: Use the sample data and confidence level given below to complete parts (a) through (d). A research…
A:
Q: Which of the following dispersions of scores for two groups, A and B, best illustrates the null…
A: The objective is to identify which of the given dispersions of scores for two groups A and B…
Q: Mr. Zuro finds the mean height of all 16 students in his statistics class to be 66.0 inches. Just as…
A:
Q: For the distribution shown below, identify the mean, median and mode. Frequency 2.5 2.0 1.5 1.0 9:0…
A: It is given that the frequency distribution graph. Here, need to find out the correct choice for the…
Q: LADS, TIL gy assignments, and a final exam. The final average for the course is the weighted average…
A: The given data is Assignments Tests Labs Homework Final exam Weights 29% 9% 16% 46% grades…
Q: Compute the least-squares regression line for predicting y from x given the following summary…
A: given data x¯ = 6y ¯ = 30.2sx = 2.3sy = 1.8r = 0.40we have to compute least square regression line…
Q: (a) About 99.7% of organs will be between what weights? (b) What percentage of organs weighs between…
A: “Since you have posted a question with multiple sub-parts, we will solve first three subparts for…
Q: Find the moment generating function of the random variable whose moments are given by m =(n+1)! 2"
A:
Q: stion 11 True or False: The IQR is sometimes preferred over standard deviation as a measure of…
A: Answer: The Given statement is True. That is the IQR(Inter Quartile Range) is sometimes preferred…
Q: Find the interquartile range and quartile deviation for the data in (a) Table 2.29 and (b) Table…
A: Hint: First convert the given series into exclusive type and then calculate Q1 and Q3 as;…
Q: A pharmaceutical company has recently introduced a new pain killer into the market. The pain killer…
A: Answer: The Holt's Exponential Method, The three equation of this method are 1.Level of estimate…
Q: A sample is collected from the items produced by a company. The sample size is 49. The standard…
A: Answer: From the given data, Population standard deviation (σ) = 0.32 Sample size (n) = 49
Q: (f) P(A and C) = 0.069
A: Given that A B C Total Male 6 30 11 47 Female 19 16 15 50 Total 25 46 26 97
Q: The following data represent the number of gallons of milk, in thousands, which were sold by various…
A: We have given data are 13,15,7,10,16,4,6,12,14,8,12,5,8,6,14,2 Arranging the given data in ascending…
Q: $ 45 Million is as bad as not getting it (assume loss), except in case of a tie (assume win). (a)…
A:
Q: Find the value of 80th percentile Find D5 Find Q1
A: Since you have posted a question with multiple sub-parts, we will solve first three subparts for…
Q: an example of a discrete quantitative ent grade point average e spent preparing for SAT
A: A variable can be used to characterize a individual quantitative or qualitative characteristics.…
Q: student government posts. If four stud Find the probability that exactly two sen. [Hint: How many…
A: A group of three undergraduate students and six graduate students is given to fill government posts.…
Q: Susan has just completed her second semester in college. She earned a grade of C in her 1-hour…
A: For the given data Find Susan's grade point average is =?
Q: The following data represent the pulse rates (beats per minute) of nine students enrolled in a…
A: Given data: Student Pulse Perpectual Bempah 64 Megan Brooks 75 Jeff Honeycutt 62 Clarice…
Q: The stem-and-leaf plot shows house sale prices over the last week in Tacoma. The stem is in hundres…
A: Stem and leaf plot is given. 0|667778999 1|02447778889999 2|0011234445667889 3|00011223
Q: 5) A maize farmer plans to plant varieties X and Y of maize each in four plots. Illustrate a…
A:
Q: 2 3 4 S 6 Va Eight blood types are shown by the eight regions of the Venn diagram shown here. Each…
A: Introduction: It is required to find the number of people with blood type B−.
Q: #1 only
A: Given that p = 0.02 p : probability of connecting a call X ~ Geometric(p = 0.02) Probability mass…
Q: Another measure of central tendency is the trimmed mean. It is computed by determining the mean of a…
A: We have given data are…
Q: If A and B are two events with P(A) = 2/3, P(B) = 1/5, P(ANB) = 1/15 then Find P(ANB)
A:
Q: company specializes in installing and servicing central-heating furnaces. In the prewinter period,…
A: Given that Number of order (X) 0 1 2 3 4 5 Probability (p(x)) 0.10 0.14 0.26 0.28 0.15…
Q: (c) Estimate the percentage of amounts that were between $42.92 and $45.75, Round the answer to one…
A:
Q: (d) Calculate the fitted y, for each value of x; used to fit the model. Then construct a graph of ŷ,…
A: Given data: Taxes Sale price 4.9176 25.9 5.0208 29.5 4.5429 27.9 4.5573 25.9 5.0597…
Q: 35 For the grouped data of Table 2.29, find (a) the first quartile, (b) the second quartile.…
A: Data is given For price and corresponding frequency We have to calculate 3rd quartile and 70…
TYPEWRITTEN AND COMPLETE FOR UPVOTE

Step by step
Solved in 4 steps

- If a researcher reported for a single-sample t-test that t(17) = 2.90, p<.02, how many subjects were there in the study?If a researcher reported for a single-sample t-test that t(17) = 2.90, p< 0.02, how many subjects were there in the study? A. 20 B. 10 C. 9 D. 18Determine if there is a significant difference among the samples. A1 A2 A3 35 46 37 44 41 26 49 31 34 52 42 53 33 36 41 Total 213 196 191 State your hypothesis and show your solution and state your final conclusion.
- Consider sample data with x = 12 and s = 3. (a) Compute the coefficient of variation.With a sample size of 5, the P(t<x)=0.57P(t<x)=0.57. What is xxIn a lightbulb factory, an administrator selects a random sample of bulbs produced on assembly line A and a random sample of bulbs produced on assembly line B. The administrator calculates the proportion of malfunctioning bulbs produced by each assembly line and finds that the difference between them (A - B) is 0.008. A researcher conducted a hypothesis test with the following hypotheses: H0: The proportion of malfunctioning bulbs from assembly line A is the sample as the proportion of malfunctioning bulbs from assembly line B. HA: The proportion of malfunctioning bulbs from assembly line A is greater than the proportion of malfunctioning bulbs from assembly line B. She found a P-value of 0.016. What is the best interpretation of this P-value? a If there is no difference in the proportions of all defective parts made on the two assembly lines, the probability of observing a difference of at least 0.008 is 0.016. b If there is a difference of 0.016 in the proportions…
- A state-by-state survey found that the proportions of adults who are smokers in state A and state B were 23.1% and 17.2%, respectively. (Suppose the number of respondents from each state was 2000.) At α=0.05, can you support the claim that the proportion of adults who are smokers is greater in state A than in state B? Assume the random samples are independent. Complete parts (a) through (e).1.Find the measured variable x, write X's data type, write the sample size n, and describe the population of interest for each problem. a. An analyst records 30 randomly selected stock values b. Your company's marketing specialist randomly selects and records 120 scanned item types. c. To examine pesticide limits in a large lake, the FDA captures 25 fish from the lake and measures the pesticide level in each fish. d. A lumber yard manager selects 200 random paint can sales and records each paint color.The total size of a university is 7,610. Determine the sample size for a study using the COchran's formula provided that Z = 1.96 and e = 0.05
- If we are testing for the difference between the means of 2 related populations with samples of n1=20 and n2=20, the number of degrees of freedom is equal to ________. a. 18 b. 19 c. 38 d. 39Where are the deer? Random samples of square-kilometer plots were taken in different ecological locations of a national park. The deer counts per square kilometer were recorded and are shown in the following table. Mountain Brush Sagebrush Grassland Pinon Juniper 30 21 2 26 58 6 20 13 8 31 20 13 Find SSTOT, SSBET, and SSW and check that SSTOT = SSBET + SSW. (Use 3 decimal places.) SSTOT = SSBET = SSW = Find d.f.BET, d.f.W, MSBET, and MSW. (Use 2 decimal places for MSBET, and MSW.) dfBET = dfW = MSBET = MSW = Find the value of the sample F statistic. (Use 3 decimal places.) What are the degrees of freedom? Find the P-value of the sample test statistic. Make a summary table for your ANOVA test.4. For a sample of 12 observations, a businessman wants to regress the price (in dollar) of the laptop (Y) on the processor's speed (X). The summary results of the observations are given below. Σx = 19.8 , Σy = 24798, Σxy = 431882 Σx^2 = 3388, Σγ^2 = 57365692 (c) Find the predicted price of the laptop (y) for the processor speed x-1.9. (d) Compute the coefficient of determination and comment.