A CBS News poll conducted June 10 and 11, 2006, among a nationwide random sample of 651 adults, asked those adults about their party affiliation (Democrat, Republican or none) and their opinion of how the US economy was changing ("getting better," "getting worse" or "about the same"). The results are shown in the table below. better ame worse Republican 38 104 44 Democrat 12 87 137 none 21 90 118 Express your answers as a decimal and round to the nearest 0.001 (in other words, type 0.123, not 12.3% or 0.123456). If we randomly select one of the adults who participated in this study, compute: P(affiliated with neither party) = P(worse) = P(worselaffiliated with neither party) = P(affiliated with neither party worse) = P(affiliated with neither party and worse) = Submit Question MacBook Ai 80 DII DD F2 F3 F4 F5 F6 F7 F8 F9 @ # $ 2 3 4 5 7 8.
A CBS News poll conducted June 10 and 11, 2006, among a nationwide random sample of 651 adults, asked those adults about their party affiliation (Democrat, Republican or none) and their opinion of how the US economy was changing ("getting better," "getting worse" or "about the same"). The results are shown in the table below. better ame worse Republican 38 104 44 Democrat 12 87 137 none 21 90 118 Express your answers as a decimal and round to the nearest 0.001 (in other words, type 0.123, not 12.3% or 0.123456). If we randomly select one of the adults who participated in this study, compute: P(affiliated with neither party) = P(worse) = P(worselaffiliated with neither party) = P(affiliated with neither party worse) = P(affiliated with neither party and worse) = Submit Question MacBook Ai 80 DII DD F2 F3 F4 F5 F6 F7 F8 F9 @ # $ 2 3 4 5 7 8.

Algebra & Trigonometry with Analytic Geometry
13th Edition
ISBN:9781133382119
Author:Swokowski
Publisher:Swokowski
Chapter10: Sequences, Series, And Probability
Section10.8: Probability
Problem 32E

Related questions
Question
Round to the fourth decimal
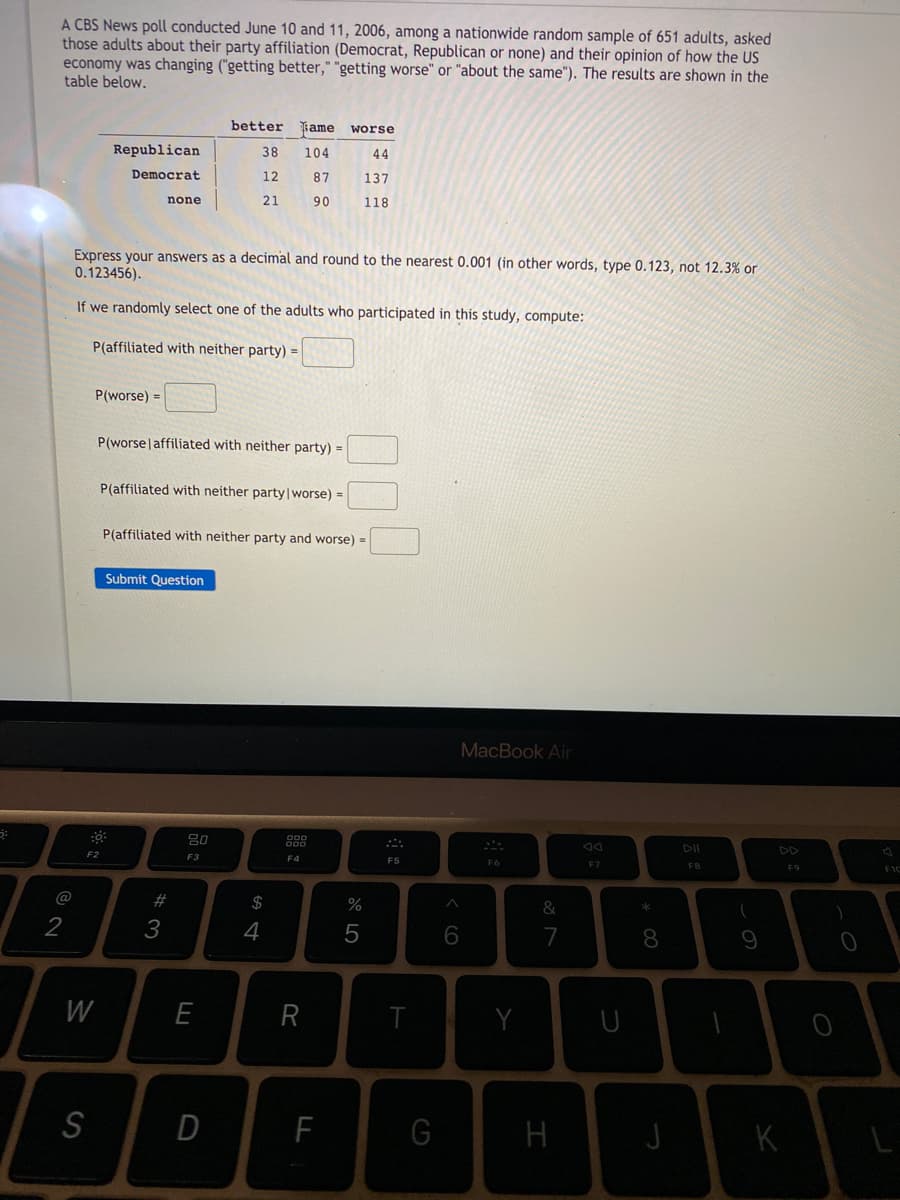
Transcribed Image Text:A CBS News poll conducted June 10 and 11, 2006, among a nationwide random sample of 651 adults, asked
those adults about their party affiliation (Democrat, Republican or none) and their opinion of how the US
economy was changing ("getting better," "getting worse" or "about the same"). The results are shown in the
table below.
better
ame
worse
Republican
38
104
44
Democrat
12
87
137
none
21
90
118
Express your answers as a decimal and round to the nearest 0.001 (in other words, type 0.123, not 12.3% or
0.123456).
If we randomly select one of the adults who participated in this study, compute:
P(affiliated with neither party) =
P(worse) =
P(worselaffiliated with neither party) =
P(affiliated with neither party|worse) =
P(affiliated with neither party and worse) =
Submit Question
MacBook Air
80
DII
F2
F3
F4
F5
F6
F7
F8
F9
@
#
$
&
*
2
3
4
5
7
8.
W
E
R
Y
S
D
H
K
Expert Solution
This question has been solved!
Explore an expertly crafted, step-by-step solution for a thorough understanding of key concepts.

This is a popular solution!

Trending now
This is a popular solution!

Step by step
Solved in 2 steps with 2 images

Recommended textbooks for you
Algebra & Trigonometry with Analytic Geometry
Algebra
ISBN:
9781133382119
Author:
Swokowski
Publisher:
Cengage
Algebra & Trigonometry with Analytic Geometry
Algebra
ISBN:
9781133382119
Author:
Swokowski
Publisher:
Cengage