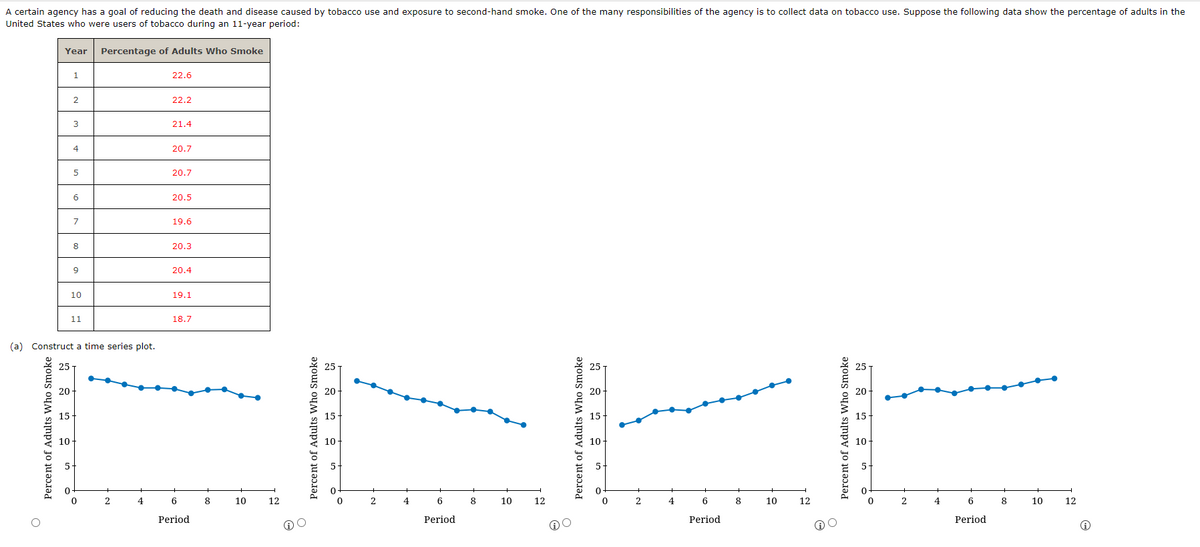
A certain agency has a goal of reducing the death and disease caused by tobacco use and exposure to second-hand smoke. One of the many responsibilities of the agency is to collect data on tobacco use. Suppose the following data show the percentage of adults in the United States who were users of tobacco during an 11-year period: Year Percentage of Adults Who Smoke 1 2 22.6 22.2 3 21.4 20.7 5 20.7 6 20.5 7 19.6 8 20.3 9 20.4 10 11 (a) Construct a time series plot. Percent of Adults Who Smoke 25 20 15 10 5 19.1 18.7 2 4 6 8 10 12 Period Percent of Adults Who Smoke 15- 10 5 0 0 2 4 6 8 10 12 Period Percent of Adults Who Smoke 10 2 4 6 8 10 12 Period Percent of Adults Who Smoke 15 10- 5. 0 2 4 6 8 10 12 Period What type of pattern exists in the data? The time series plot exhibits a seasonal pattern. The time series plot exhibits a horizontal pattern. The time series plot exhibits a cyclical pattern. ◇ The time series plot exhibits a trend pattern. (b) Use simple linear regression to find the parameters for the line that minimizes MSE for this time series. (Round your answers to three decimal places.) b1 bo = = (c) One of the agency's goals is to cut the percentage of adults in the United States who were users of tobacco to 12% or less by year 20. Find the forecast of the percent of adults who smoke for year 20. (Round your answer to one decimal place.) Ŷ 20 = % Does your regression model from part (b) suggest that the agency is on target to meet this goal? Yes No If not, use your model from part (b) to estimate the year in which the agency will achieve this goal. (Enter 20 if the goal will be met by year 20.)
A certain agency has a goal of reducing the death and disease caused by tobacco use and exposure to second-hand smoke. One of the many responsibilities of the agency is to collect data on tobacco use. Suppose the following data show the percentage of adults in the United States who were users of tobacco during an 11-year period: Year Percentage of Adults Who Smoke 1 2 22.6 22.2 3 21.4 20.7 5 20.7 6 20.5 7 19.6 8 20.3 9 20.4 10 11 (a) Construct a time series plot. Percent of Adults Who Smoke 25 20 15 10 5 19.1 18.7 2 4 6 8 10 12 Period Percent of Adults Who Smoke 15- 10 5 0 0 2 4 6 8 10 12 Period Percent of Adults Who Smoke 10 2 4 6 8 10 12 Period Percent of Adults Who Smoke 15 10- 5. 0 2 4 6 8 10 12 Period What type of pattern exists in the data? The time series plot exhibits a seasonal pattern. The time series plot exhibits a horizontal pattern. The time series plot exhibits a cyclical pattern. ◇ The time series plot exhibits a trend pattern. (b) Use simple linear regression to find the parameters for the line that minimizes MSE for this time series. (Round your answers to three decimal places.) b1 bo = = (c) One of the agency's goals is to cut the percentage of adults in the United States who were users of tobacco to 12% or less by year 20. Find the forecast of the percent of adults who smoke for year 20. (Round your answer to one decimal place.) Ŷ 20 = % Does your regression model from part (b) suggest that the agency is on target to meet this goal? Yes No If not, use your model from part (b) to estimate the year in which the agency will achieve this goal. (Enter 20 if the goal will be met by year 20.)

Practical Management Science
6th Edition
ISBN:9781337406659
Author:WINSTON, Wayne L.
Publisher:WINSTON, Wayne L.
Chapter13: Regression And Forecasting Models
Section13.7: Exponential Smoothing Models
Problem 27P: The file P13_27.xlsx contains yearly data on the proportion of Americans under the age of 18 living...

Related questions
Question
100%
Transcribed Image Text:A certain agency has a goal of reducing the death and disease caused by tobacco use and exposure to second-hand smoke. One of the many responsibilities of the agency is to collect data on tobacco use. Suppose the following data show the percentage of adults in the
United States who were users of tobacco during an 11-year period:
Year
Percentage of Adults Who Smoke
1
2
22.6
22.2
3
21.4
20.7
5
20.7
6
20.5
7
19.6
8
20.3
9
20.4
10
11
(a) Construct a time series plot.
Percent of Adults Who Smoke
25
20
15
10
5
19.1
18.7
2
4
6
8
10
12
Period
Percent of Adults Who Smoke
15-
10
5
0
0
2
4
6
8
10
12
Period
Percent of Adults Who Smoke
10
2
4
6
8
10
12
Period
Percent of Adults Who Smoke
15
10-
5.
0
2
4
6
8
10
12
Period
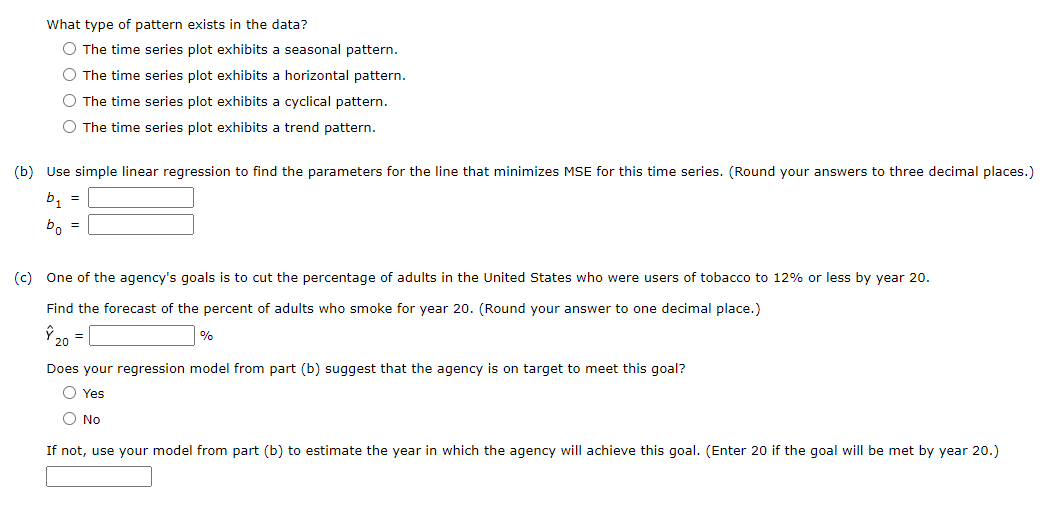
Transcribed Image Text:What type of pattern exists in the data?
The time series plot exhibits a seasonal pattern.
The time series plot exhibits a horizontal pattern.
The time series plot exhibits a cyclical pattern.
◇ The time series plot exhibits a trend pattern.
(b) Use simple linear regression to find the parameters for the line that minimizes MSE for this time series. (Round your answers to three decimal places.)
b1
bo
=
=
(c) One of the agency's goals is to cut the percentage of adults in the United States who were users of tobacco to 12% or less by year 20.
Find the forecast of the percent of adults who smoke for year 20. (Round your answer to one decimal place.)
Ŷ 20 =
%
Does your regression model from part (b) suggest that the agency is on target to meet this goal?
Yes
No
If not, use your model from part (b) to estimate the year in which the agency will achieve this goal. (Enter 20 if the goal will be met by year 20.)
Expert Solution
This question has been solved!
Explore an expertly crafted, step-by-step solution for a thorough understanding of key concepts.

This is a popular solution!

Trending now
This is a popular solution!

Step by step
Solved in 2 steps with 9 images

Recommended textbooks for you
Practical Management Science
Operations Management
ISBN:
9781337406659
Author:
WINSTON, Wayne L.
Publisher:
Cengage,
Practical Management Science
Operations Management
ISBN:
9781337406659
Author:
WINSTON, Wayne L.
Publisher:
Cengage,