A certain hurricane database extends back to 1851, recording among other data the number of major hurricanes (measuring at least a Category 3) striking a ce region per year. The following table provides a probability distribution for the number of major hurricanes, Y, for a randomly selected year between 1851 and 201 Complete parts (a) through (f) below. y P(Y=y) y P(Y=y) D 0 0.182 5 0.041 1 0.253 6 0.038 2 0.262 7 0.008 3 0.088 8 0.097 4 0.031 b. Use random-variable notation to represent the event that the year had exactly five major hurricanes. Select the correct choice below and fill in the answer box within your choice. A P B. (Y=5} c. Use random-variable notation to represent the event that the year had between 5 and 7 major hurricanes, inclusive. Select the correct choice below and fill in the answer box within your choice. OA OB. P Clear all Help me solve this Get more help - View an example
A certain hurricane database extends back to 1851, recording among other data the number of major hurricanes (measuring at least a Category 3) striking a ce region per year. The following table provides a probability distribution for the number of major hurricanes, Y, for a randomly selected year between 1851 and 201 Complete parts (a) through (f) below. y P(Y=y) y P(Y=y) D 0 0.182 5 0.041 1 0.253 6 0.038 2 0.262 7 0.008 3 0.088 8 0.097 4 0.031 b. Use random-variable notation to represent the event that the year had exactly five major hurricanes. Select the correct choice below and fill in the answer box within your choice. A P B. (Y=5} c. Use random-variable notation to represent the event that the year had between 5 and 7 major hurricanes, inclusive. Select the correct choice below and fill in the answer box within your choice. OA OB. P Clear all Help me solve this Get more help - View an example

Chapter8: Sequences, Series,and Probability
Section8.7: Probability
Problem 38E

Related questions
Question
I need question C answer
Transcribed Image Text:ce
sources
tions
Lion Tools
esc
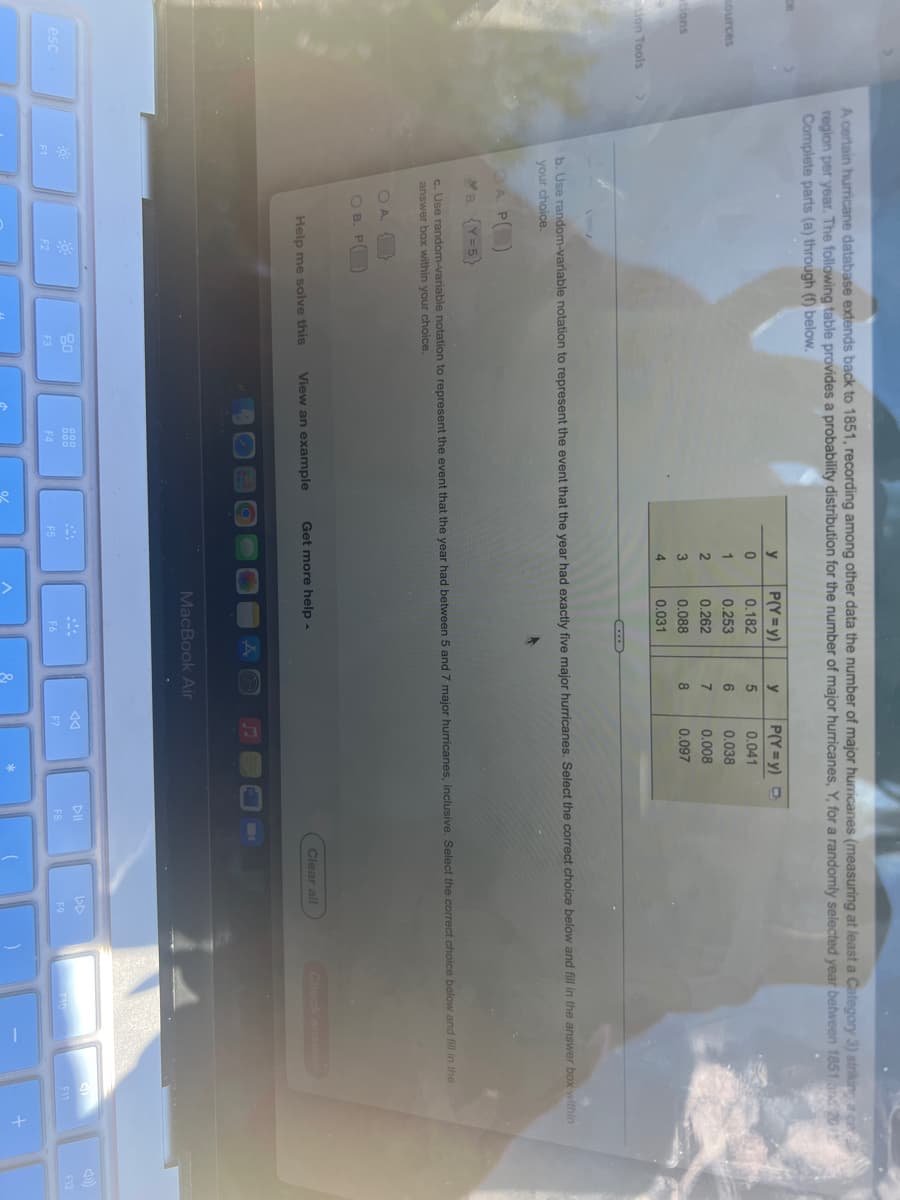
A certain hurricane database extends back to 1851, recording among other data the number of major hurricanes (measuring at least a Category 3) striking a ce
region per year. The following table provides a probability distribution for the number of major hurricanes, Y, for a randomly selected year between 1851 and 2011
Complete parts (a) through (f) below.
y
P(Y=y)
y
P(Y=y) D
0
0.182
5
0.041
1
0.253
6
0.038
2
0.262
7
0.008
3
0.088
8
0.097
4
0.031
V
b. Use random-variable notation to represent the event that the year had exactly five major hurricanes. Select the correct choice below and fill in the answer box within
your choice.
A P
B. {Y=5}
c. Use random-variable notation to represent the event that the year had between 5 and 7 major hurricanes, inclusive. Select the correct choice below and fill in the
answer box within your choice.
OA
{}
Clear all
Check answers
Help me solve this
Get more help.
View an example
20
0000
F10
F2
F3
F4
F1
OB. P
F5
MacBook Air
F6
F7
*
DII
F8
14
DD
F9
F11
+
F12
Expert Solution
This question has been solved!
Explore an expertly crafted, step-by-step solution for a thorough understanding of key concepts.

This is a popular solution!

Trending now
This is a popular solution!

Step by step
Solved in 2 steps with 1 images

Recommended textbooks for you

College Algebra
Algebra
ISBN:
9781305115545
Author:
James Stewart, Lothar Redlin, Saleem Watson
Publisher:
Cengage Learning

Algebra & Trigonometry with Analytic Geometry
Algebra
ISBN:
9781133382119
Author:
Swokowski
Publisher:
Cengage
College Algebra
Algebra
ISBN:
9781305115545
Author:
James Stewart, Lothar Redlin, Saleem Watson
Publisher:
Cengage Learning
Algebra & Trigonometry with Analytic Geometry
Algebra
ISBN:
9781133382119
Author:
Swokowski
Publisher:
Cengage