Write a brief report about the analysis by identifying the set of hypotheses to be tested, the appropriate test to use, and implications and recommendations of/from the conclusions. (What is the characteristic of interest? Is it really just the proportion of males and that of females? Be specific.)
Write a brief report about the analysis by identifying the set of hypotheses to be tested, the appropriate test to use, and implications and recommendations of/from the conclusions. (What is the characteristic of interest? Is it really just the proportion of males and that of females? Be specific.)

MATLAB: An Introduction with Applications
6th Edition
ISBN:9781119256830
Author:Amos Gilat
Publisher:Amos Gilat
Chapter1: Starting With Matlab
Section: Chapter Questions
Problem 1P

Related questions
Question
Write a brief report about the analysis by identifying the set of hypotheses to be tested, the appropriate test to use, and implications and recommendations of/from the conclusions. (What is the characteristic of interest? Is it really just the proportion of males and that of females? Be specific.)
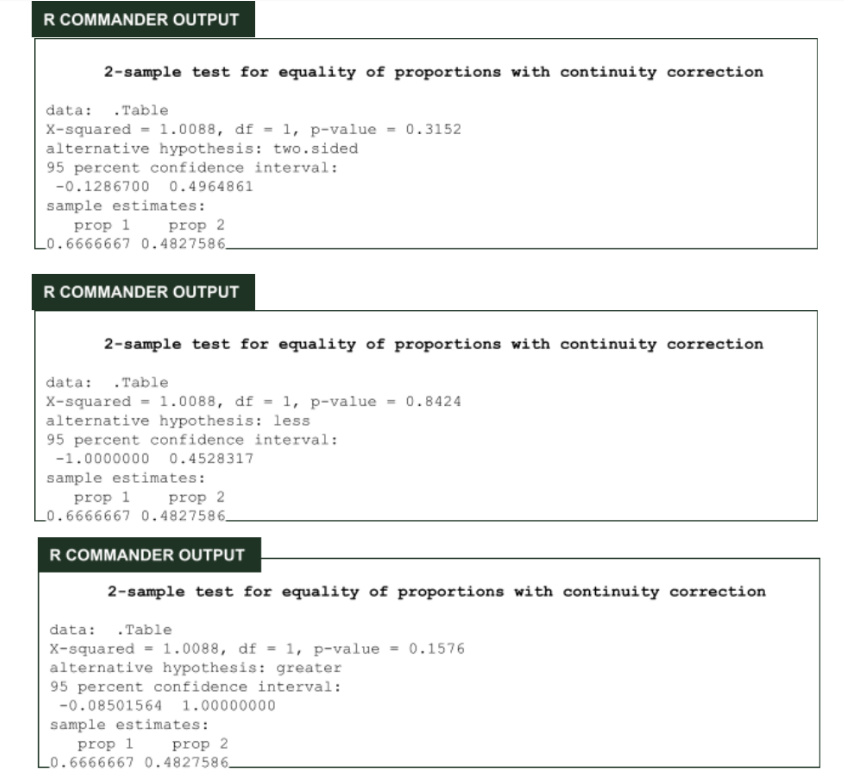
Transcribed Image Text:R COMMANDER OUTPUT
2-sample test for equality of proportions with continuity correction
data: .Table
X-squared = 1.0088, df = 1, p-value = 0.3152
alternative hypothesis: two.sided
95 percent confidence interval:
-0.1286700 0.4964861
sample estimates:
prop 1 prop 2
0.6666667 0.4827586
R COMMANDER OUTPUT
2-sample test for equality of proportions with continuity correction
data: .Table
X-squared = 1.0088, df = 1, p-value = 0.8424
alternative hypothesis: less
95 percent confidence interval:
-1.0000000 0.4528317
sample estimates:
prop 1
prop 2
0.6666667 0.4827586_
R COMMANDER OUTPUT
2-sample test for equality of proportions with continuity correction
data: .Table
= 0.1576
X-squared = 1.0088, df = 1, p-value
alternative hypothesis: greater
95 percent confidence interval:
-0.08501564 1.00000000
sample estimates:
prop 1
prop 2
0.6666667 0.4827586
Transcribed Image Text:In a recent study conducted by Pulse Measurement Asia, their results show that a higher percentage of
females have normal resting pulse rate compared with males. Dr. Castillejo is interested to know whether this
result also applies among gym members. Use the R commander output below to test Dr. Castillejo's claim.
Write a brief report about the analysis by identifying the set of hypotheses to be tested, the appropriate test to
use, and implications and recommendations of/from the conclusions. Note: The following R commander
output defines the difference to be Female - Male.
Expert Solution
This question has been solved!
Explore an expertly crafted, step-by-step solution for a thorough understanding of key concepts.

Step by step
Solved in 2 steps

Recommended textbooks for you
MATLAB: An Introduction with Applications
Statistics
ISBN:
9781119256830
Author:
Amos Gilat
Publisher:
John Wiley & Sons Inc

Probability and Statistics for Engineering and th…
Statistics
ISBN:
9781305251809
Author:
Jay L. Devore
Publisher:
Cengage Learning

Statistics for The Behavioral Sciences (MindTap C…
Statistics
ISBN:
9781305504912
Author:
Frederick J Gravetter, Larry B. Wallnau
Publisher:
Cengage Learning
MATLAB: An Introduction with Applications
Statistics
ISBN:
9781119256830
Author:
Amos Gilat
Publisher:
John Wiley & Sons Inc
Probability and Statistics for Engineering and th…
Statistics
ISBN:
9781305251809
Author:
Jay L. Devore
Publisher:
Cengage Learning
Statistics for The Behavioral Sciences (MindTap C…
Statistics
ISBN:
9781305504912
Author:
Frederick J Gravetter, Larry B. Wallnau
Publisher:
Cengage Learning

Elementary Statistics: Picturing the World (7th E…
Statistics
ISBN:
9780134683416
Author:
Ron Larson, Betsy Farber
Publisher:
PEARSON

The Basic Practice of Statistics
Statistics
ISBN:
9781319042578
Author:
David S. Moore, William I. Notz, Michael A. Fligner
Publisher:
W. H. Freeman

Introduction to the Practice of Statistics
Statistics
ISBN:
9781319013387
Author:
David S. Moore, George P. McCabe, Bruce A. Craig
Publisher:
W. H. Freeman