A chain of restaurants advertises that the mean wait time, , for a customer is at most 9 minutes. To test the restaurant chain's claim, a consumer advocate takes a random sample of 44 customers. The mean wait time for the sample is 10.4 minutes. Assume the population standard deviation for the wait times is known to be 4.1 minutes. Is there enough evidence to reject the claim that the mean wait time is at most 9 minutes? Perform a hypothesis test, using the o.0s level of significance. (a) State the null hypothesis H, and the alternative hypothesis H,.
A chain of restaurants advertises that the mean wait time, , for a customer is at most 9 minutes. To test the restaurant chain's claim, a consumer advocate takes a random sample of 44 customers. The mean wait time for the sample is 10.4 minutes. Assume the population standard deviation for the wait times is known to be 4.1 minutes. Is there enough evidence to reject the claim that the mean wait time is at most 9 minutes? Perform a hypothesis test, using the o.0s level of significance. (a) State the null hypothesis H, and the alternative hypothesis H,.

MATLAB: An Introduction with Applications
6th Edition
ISBN:9781119256830
Author:Amos Gilat
Publisher:Amos Gilat
Chapter1: Starting With Matlab
Section: Chapter Questions
Problem 1P

Related questions
Topic Video
Question
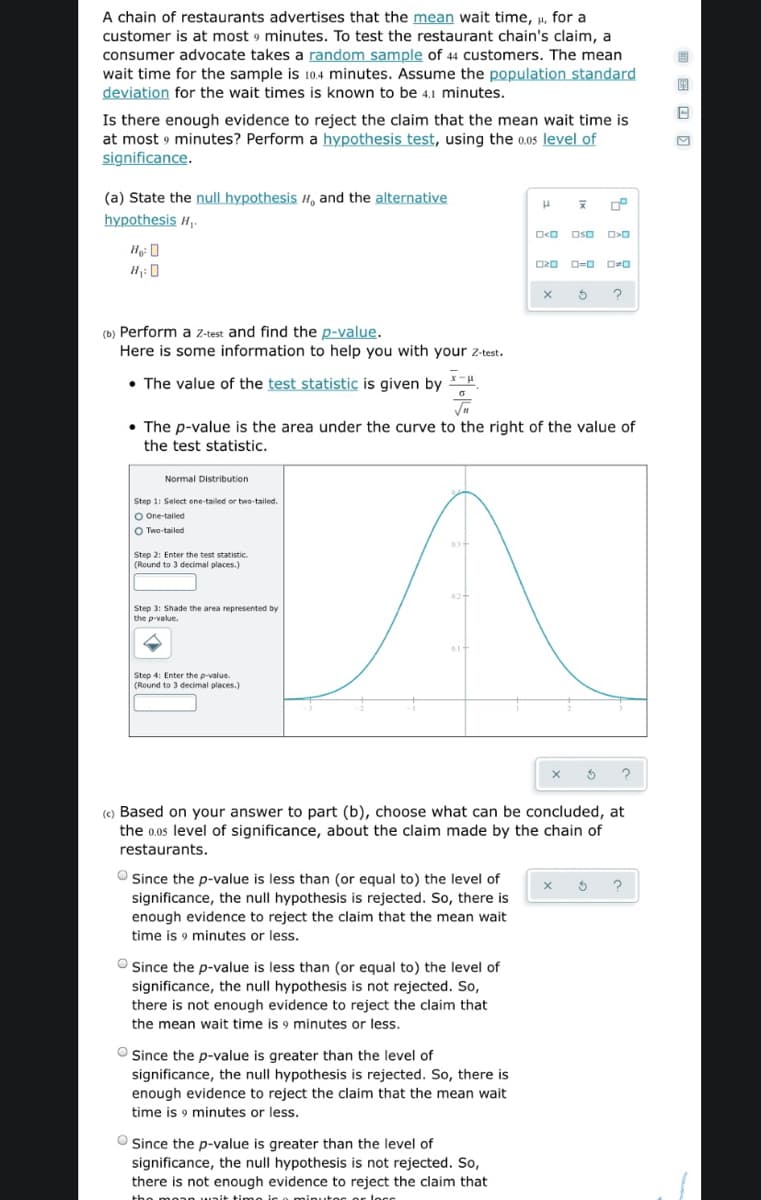
Transcribed Image Text:A chain of restaurants advertises that the mean wait time, µ, for a
customer is at most 9 minutes. To test the restaurant chain's claim, a
consumer advocate takes a random sample of 44 customers. The mean
wait time for the sample is 10.4 minutes. Assume the population standard
deviation for the wait times is known to be 4.1 minutes.
Is there enough evidence to reject the claim that the mean wait time is
at most 9 minutes? Perform a hypothesis test, using the 0.05 level of
significance.
(a) State the null hypothesis H, and the alternative
hypothesis H,.
O<O Oso
O20 D=0 D=0
H1: 0
(b) Perform a z-test and find the p-value.
Here is some information to help you with your z-test.
• The value of the test statistic is given by .
• The p-value is the area under the curve to the right of the value of
the test statistic.
Normal Distribution
Step 1: Select ene-tailed or two-tailed.
O One-tailed
O Two-tailed
Step 2: Enter the test statistic.
(Round to 3 decimal places.)
Step 3: Shade the area represented by
the p-value,
Step 4: Enter the p-value.
(Round to 3 decimal places.)
(c) Based on your answer to part (b), choose what can be concluded, at
the 0.0s level of significance, about the claim made by the chain of
restaurants.
O Since the p-value is less than (or equal to) the level of
significance, the null hypothesis is rejected. So, there is
enough evidence to reject the claim that the mean wait
time is 9 minutes or less.
O Since the p-value is less than (or equal to) the level of
significance, the null hypothesis is not rejected. So,
there is not enough evidence to reject the claim that
the mean wait time is 9 minutes or less.
O Since the p-value is greater than the level of
significance, the null hypothesis is rejected. So, there is
enough evidence to reject the claim that the mean wait
time is 9 minutes or less.
O Since the p-value is greater than the level of
significance, the null hypothesis is not rejected. So,
there is not enough evidence to reject the claim that
minutor or loco
tho m
unit timo i
Expert Solution
This question has been solved!
Explore an expertly crafted, step-by-step solution for a thorough understanding of key concepts.

This is a popular solution!

Trending now
This is a popular solution!

Step by step
Solved in 2 steps with 1 images

Knowledge Booster


Learn more about
Need a deep-dive on the concept behind this application? Look no further. Learn more about this topic, statistics and related others by exploring similar questions and additional content below.Recommended textbooks for you
MATLAB: An Introduction with Applications
Statistics
ISBN:
9781119256830
Author:
Amos Gilat
Publisher:
John Wiley & Sons Inc

Probability and Statistics for Engineering and th…
Statistics
ISBN:
9781305251809
Author:
Jay L. Devore
Publisher:
Cengage Learning

Statistics for The Behavioral Sciences (MindTap C…
Statistics
ISBN:
9781305504912
Author:
Frederick J Gravetter, Larry B. Wallnau
Publisher:
Cengage Learning
MATLAB: An Introduction with Applications
Statistics
ISBN:
9781119256830
Author:
Amos Gilat
Publisher:
John Wiley & Sons Inc
Probability and Statistics for Engineering and th…
Statistics
ISBN:
9781305251809
Author:
Jay L. Devore
Publisher:
Cengage Learning
Statistics for The Behavioral Sciences (MindTap C…
Statistics
ISBN:
9781305504912
Author:
Frederick J Gravetter, Larry B. Wallnau
Publisher:
Cengage Learning

Elementary Statistics: Picturing the World (7th E…
Statistics
ISBN:
9780134683416
Author:
Ron Larson, Betsy Farber
Publisher:
PEARSON

The Basic Practice of Statistics
Statistics
ISBN:
9781319042578
Author:
David S. Moore, William I. Notz, Michael A. Fligner
Publisher:
W. H. Freeman

Introduction to the Practice of Statistics
Statistics
ISBN:
9781319013387
Author:
David S. Moore, George P. McCabe, Bruce A. Craig
Publisher:
W. H. Freeman