A chain of restaurants has historically had a mean wait time of 9 minutes for íts customers. Recently, the restaurant added several very popular dis their menu. Due to this, the manager suspects the wait time, u, has increased. He takes a random sample of 44 customers. The mean wait time fo is 10.4 minutes. Assume the population standard deviation for the wait times is known to be 3.3 minutes. Can the manager conclude that the mean wait time is now greater than 9 minutes? Perform a hypothesis test, using the 0.05 level of significance. (a) State the null hypothesis H, and the alternative hypothesis H,. Ho: I O
A chain of restaurants has historically had a mean wait time of 9 minutes for íts customers. Recently, the restaurant added several very popular dis their menu. Due to this, the manager suspects the wait time, u, has increased. He takes a random sample of 44 customers. The mean wait time fo is 10.4 minutes. Assume the population standard deviation for the wait times is known to be 3.3 minutes. Can the manager conclude that the mean wait time is now greater than 9 minutes? Perform a hypothesis test, using the 0.05 level of significance. (a) State the null hypothesis H, and the alternative hypothesis H,. Ho: I O

MATLAB: An Introduction with Applications
6th Edition
ISBN:9781119256830
Author:Amos Gilat
Publisher:Amos Gilat
Chapter1: Starting With Matlab
Section: Chapter Questions
Problem 1P

Related questions
Question
100%
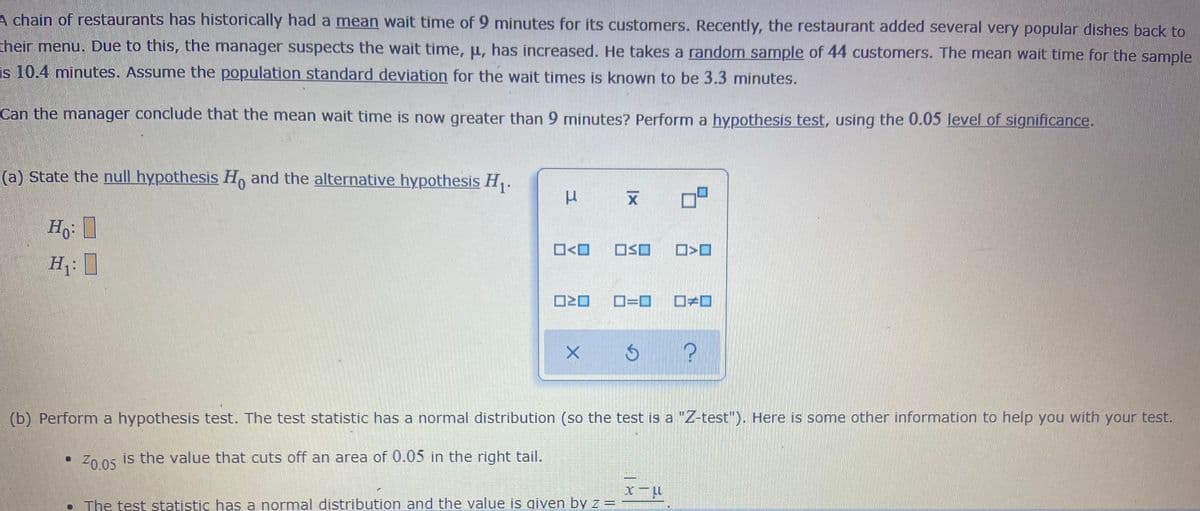
Transcribed Image Text:A chain of restaurants has historically had a mean wait time of 9 minutes for its customers. Recently, the restaurant added several very popular dishes back to
their menu. Due to this, the manager suspects the wait time, u, has increased. He takes a random sample of 44 customers. The mean wait time for the sample
is 10.4 minutes. Assume the population standard deviation for the wait times is known to be 3.3 minutes.
Can the manager conclude that the mean wait time is now greater than 9 minutes? Perform a hypothesis test, using the 0.05 level of significance.
(a) State the null hypothesis H, and the alternative hypothesis H.
H,: 1
O<O
OSO
O=D
(b) Perform a hypothesis test. The test statistic has a normal distribution (so the test is a "Z-test"). Here is some other information to help you with your test.
Zn 05 is the value that cuts off an area of 0.05 in the right tail.
• The test statistic has a normal distribution and the value is given by z =
|x
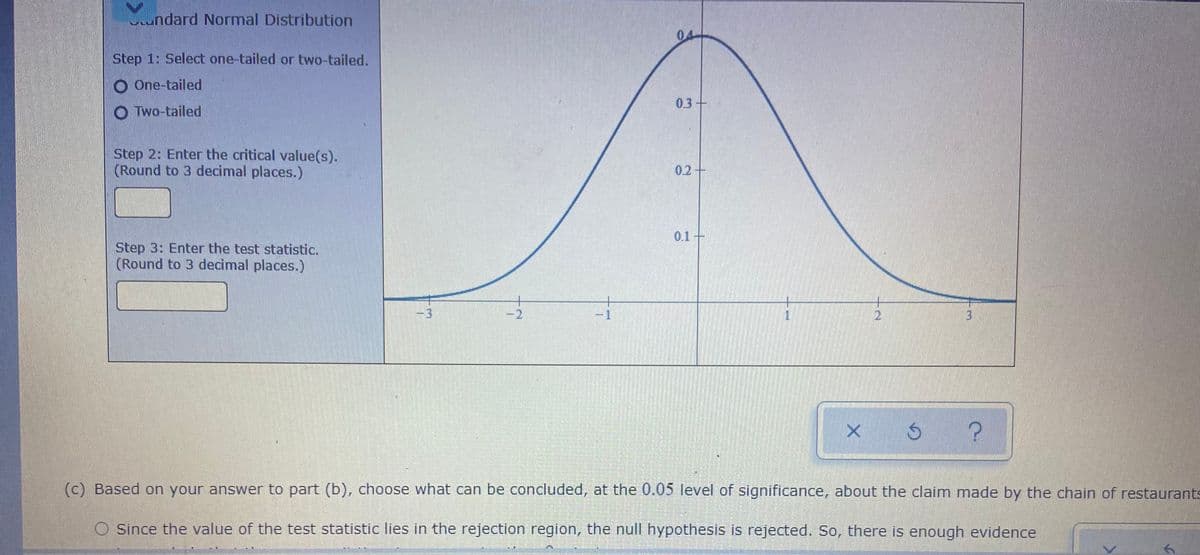
Transcribed Image Text:Lundard Normal Distribution
04
Step 1: Select one-tailed or two-tailed.
O One-tailed
0.3+
O Two-tailed
Step 2: Enter the critical value(s).
(Round to 3 decimal places.)
0.2+
0.1+
Step 3: Enter the test statistic.
(Round to 3 decimal places.)
3
-2
-1
2.
(c) Based on your answer to part (b), choose what can be concluded, at the 0.05 level of significance, about the claim made by the chain of restaurants
O Since the value of the test statistic lies in the rejection region, the null hypothesis is rejected. So, there is enough evidence
Expert Solution
This question has been solved!
Explore an expertly crafted, step-by-step solution for a thorough understanding of key concepts.

This is a popular solution!

Trending now
This is a popular solution!

Step by step
Solved in 2 steps with 2 images

Recommended textbooks for you
MATLAB: An Introduction with Applications
Statistics
ISBN:
9781119256830
Author:
Amos Gilat
Publisher:
John Wiley & Sons Inc

Probability and Statistics for Engineering and th…
Statistics
ISBN:
9781305251809
Author:
Jay L. Devore
Publisher:
Cengage Learning

Statistics for The Behavioral Sciences (MindTap C…
Statistics
ISBN:
9781305504912
Author:
Frederick J Gravetter, Larry B. Wallnau
Publisher:
Cengage Learning
MATLAB: An Introduction with Applications
Statistics
ISBN:
9781119256830
Author:
Amos Gilat
Publisher:
John Wiley & Sons Inc
Probability and Statistics for Engineering and th…
Statistics
ISBN:
9781305251809
Author:
Jay L. Devore
Publisher:
Cengage Learning
Statistics for The Behavioral Sciences (MindTap C…
Statistics
ISBN:
9781305504912
Author:
Frederick J Gravetter, Larry B. Wallnau
Publisher:
Cengage Learning

Elementary Statistics: Picturing the World (7th E…
Statistics
ISBN:
9780134683416
Author:
Ron Larson, Betsy Farber
Publisher:
PEARSON

The Basic Practice of Statistics
Statistics
ISBN:
9781319042578
Author:
David S. Moore, William I. Notz, Michael A. Fligner
Publisher:
W. H. Freeman

Introduction to the Practice of Statistics
Statistics
ISBN:
9781319013387
Author:
David S. Moore, George P. McCabe, Bruce A. Craig
Publisher:
W. H. Freeman