A chemical engineer desiring to study the evaporation rate of water evaporation beds obtained data on the number of inches of evaporation in each of 55 July days spread over 4 years. The data are given in the following stem and leaf plot, which shows that the smallest data value was o.02 inch, and brine the largest o.56 inch. Stem Leaf 0.0 2, 6 0.1 1, 4 0.2 1, 1, 1, 3, 3, 4, 5, 5, 5, 6, 9 o, 0, 2, 2, 2, 3, 3, 3, 3, 4, 4, 5, 5, 5, 6, 6, 7, 8, 9 0, 1, 2, 2, 2, 3, 4, 4, 4, 5, 5, 5, 7, 8, 8, 8, 9, 9 2, 5, 6 0.3 0.4 0.5 Find the: a) sample mean; b) sample median; c) sample standard deviation of these data. d) Do the data appear to be approximately normal? e) What percentage of data values are within 1 standard deviation of the mean?
A chemical engineer desiring to study the evaporation rate of water evaporation beds obtained data on the number of inches of evaporation in each of 55 July days spread over 4 years. The data are given in the following stem and leaf plot, which shows that the smallest data value was o.02 inch, and brine the largest o.56 inch. Stem Leaf 0.0 2, 6 0.1 1, 4 0.2 1, 1, 1, 3, 3, 4, 5, 5, 5, 6, 9 o, 0, 2, 2, 2, 3, 3, 3, 3, 4, 4, 5, 5, 5, 6, 6, 7, 8, 9 0, 1, 2, 2, 2, 3, 4, 4, 4, 5, 5, 5, 7, 8, 8, 8, 9, 9 2, 5, 6 0.3 0.4 0.5 Find the: a) sample mean; b) sample median; c) sample standard deviation of these data. d) Do the data appear to be approximately normal? e) What percentage of data values are within 1 standard deviation of the mean?

Algebra & Trigonometry with Analytic Geometry
13th Edition
ISBN:9781133382119
Author:Swokowski
Publisher:Swokowski
Chapter7: Analytic Trigonometry
Section7.6: The Inverse Trigonometric Functions
Problem 94E

Related questions

Concept explainers
Contingency Table
A contingency table can be defined as the visual representation of the relationship between two or more categorical variables that can be evaluated and registered. It is a categorical version of the scatterplot, which is used to investigate the linear relationship between two variables. A contingency table is indeed a type of frequency distribution table that displays two variables at the same time.
Binomial Distribution
Binomial is an algebraic expression of the sum or the difference of two terms. Before knowing about binomial distribution, we must know about the binomial theorem.
Topic Video
Question
Transcribed Image Text:Item#3
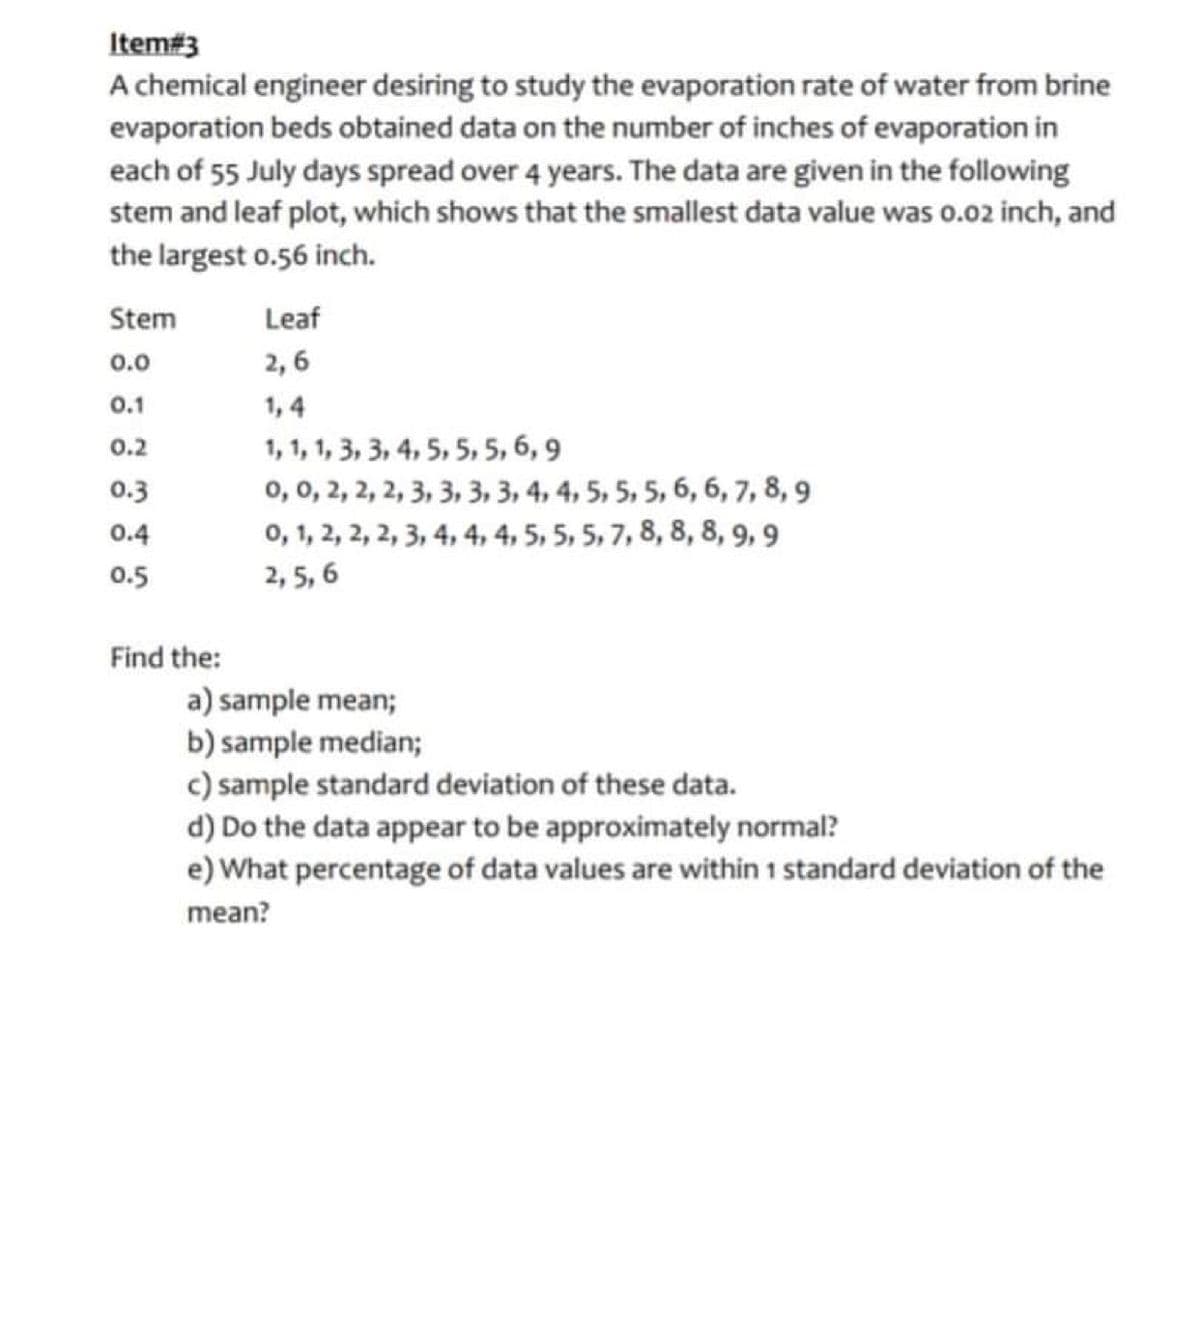
A chemical engineer desiring to study the evaporation rate of water from brine
evaporation beds obtained data on the number of inches of evaporation in
each of 55 July days spread over 4 years. The data are given in the following
stem and leaf plot, which shows that the smallest data value was o.02 inch, and
the largest o.56 inch.
Stem
Leaf
0.0
2, 6
0.1
1, 4
1, 1, 1, 3, 3, 4, 5, 5, 5, 6, 9
0, 0, 2, 2, 2, 3, 3, 3, 3, 4, 4, 5, 5, 5, 6, 6, 7, 8, 9
0, 1, 2, 2, 2, 3, 4, 4, 4, 5, 5, 5, 7, 8, 8, 8, 9, 9
2, 5, 6
0.2
0.3
0.4
0.5
Find the:
a) sample mean;
b) sample median;
c) sample standard deviation of these data.
d) Do the data appear to be approximately normal?
e) What percentage of data values are within 1 standard deviation of the
mean?
Expert Solution
This question has been solved!
Explore an expertly crafted, step-by-step solution for a thorough understanding of key concepts.

Step by step
Solved in 4 steps with 5 images

Knowledge Booster


Learn more about
Need a deep-dive on the concept behind this application? Look no further. Learn more about this topic, statistics and related others by exploring similar questions and additional content below.Recommended textbooks for you
Algebra & Trigonometry with Analytic Geometry
Algebra
ISBN:
9781133382119
Author:
Swokowski
Publisher:
Cengage

Big Ideas Math A Bridge To Success Algebra 1: Stu…
Algebra
ISBN:
9781680331141
Author:
HOUGHTON MIFFLIN HARCOURT
Publisher:
Houghton Mifflin Harcourt

Glencoe Algebra 1, Student Edition, 9780079039897…
Algebra
ISBN:
9780079039897
Author:
Carter
Publisher:
McGraw Hill
Algebra & Trigonometry with Analytic Geometry
Algebra
ISBN:
9781133382119
Author:
Swokowski
Publisher:
Cengage
Big Ideas Math A Bridge To Success Algebra 1: Stu…
Algebra
ISBN:
9781680331141
Author:
HOUGHTON MIFFLIN HARCOURT
Publisher:
Houghton Mifflin Harcourt
Glencoe Algebra 1, Student Edition, 9780079039897…
Algebra
ISBN:
9780079039897
Author:
Carter
Publisher:
McGraw Hill

Holt Mcdougal Larson Pre-algebra: Student Edition…
Algebra
ISBN:
9780547587776
Author:
HOLT MCDOUGAL
Publisher:
HOLT MCDOUGAL

Functions and Change: A Modeling Approach to Coll…
Algebra
ISBN:
9781337111348
Author:
Bruce Crauder, Benny Evans, Alan Noell
Publisher:
Cengage Learning