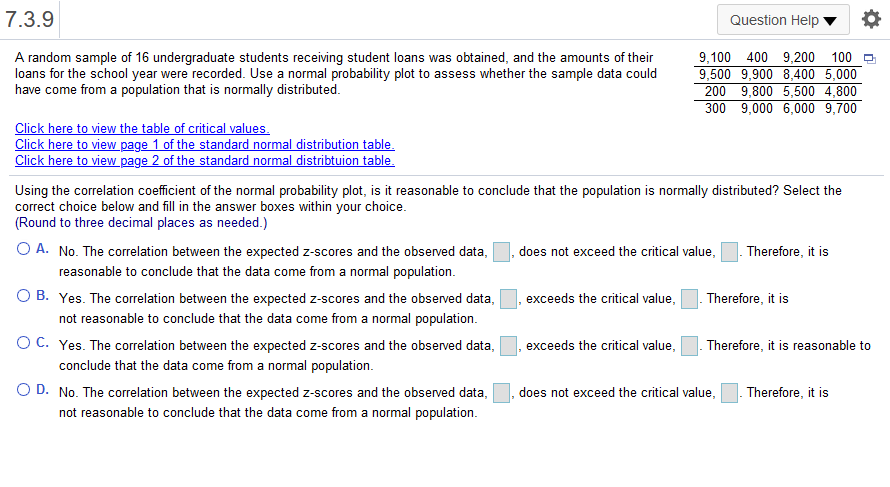
A random sample of 16 undergraduate students receiving student loans was obtained, and the amounts of their oans for the school year were recorded. Use a normal probaility plot to assess whether the sample data could have come from a population that is normally distributed. 9,100 400 9,200 100 - 9,500 9,900 8,400 5,000 200 9,800 5,500 4,800 300 9,000 6,000 9,700 Click here to view the table of critical values. Click here to view page 1 of the standard normal distribution table. Click here to view page 2 of the standard normal distribtuion table. Jsing the correlation coefficient of the normal probability plot, is it reasonable to conclude that the population is normally distributed? Select the correct choice below and fill in the answer boxes within your choice. Round to three decimal places as needed.) O A. No. The correlation between the expected z-scores and the observed data, does not exceed the critical value, . Therefore, it is reasonable to conclude that the data come from a normal population. O B. Yes. The correlation between the expected z-scores and the observed data, Therefore, it is exceeds the critical value, not reasonable to conclude that the data come from a normal population. OC. Yes. The correlation between the expected z-scores and the observed data, exceeds the critical value, Therefore, it is reasonable to conclude that the data come from a normal population. O D. No. The correlation between the expected z-scores and the observed data, does not exceed the critical value, Therefore, it is not reasonable to conclude that the data come from a normal population.


Inverse Normal Distribution
The method used for finding the corresponding z-critical value in a normal distribution using the known probability is said to be an inverse normal distribution. The inverse normal distribution is a continuous probability distribution with a family of two parameters.
Mean, Median, Mode
It is a descriptive summary of a data set. It can be defined by using some of the measures. The central tendencies do not provide information regarding individual data from the dataset. However, they give a summary of the data set. The central tendency or measure of central tendency is a central or typical value for a probability distribution.
Z-Scores
A z-score is a unit of measurement used in statistics to describe the position of a raw score in terms of its distance from the mean, measured with reference to standard deviation from the mean. Z-scores are useful in statistics because they allow comparison between two scores that belong to different normal distributions.


Trending now
This is a popular solution!

Step by step
Solved in 2 steps with 1 images


