A climatologist has been collecting sulfur dioxide readings from a sample of monitoring sites located at several different distances downwind from a coal-burning power plant. She suspects that the farther downwind a location is from the plant, the lower the sulfur dioxide concentration will be. Is this a statistically significant relationship? The Research Hypothesis is: Slope< 0 Slope 0 Slope= 0 Slope> 0 Slopes 0 Slopez 0
A climatologist has been collecting sulfur dioxide readings from a sample of monitoring sites located at several different distances downwind from a coal-burning power plant. She suspects that the farther downwind a location is from the plant, the lower the sulfur dioxide concentration will be. Is this a statistically significant relationship? The Research Hypothesis is: Slope< 0 Slope 0 Slope= 0 Slope> 0 Slopes 0 Slopez 0

Glencoe Algebra 1, Student Edition, 9780079039897, 0079039898, 2018
18th Edition
ISBN:9780079039897
Author:Carter
Publisher:Carter
Chapter4: Equations Of Linear Functions
Section4.5: Correlation And Causation
Problem 24PFA

Related questions
Question
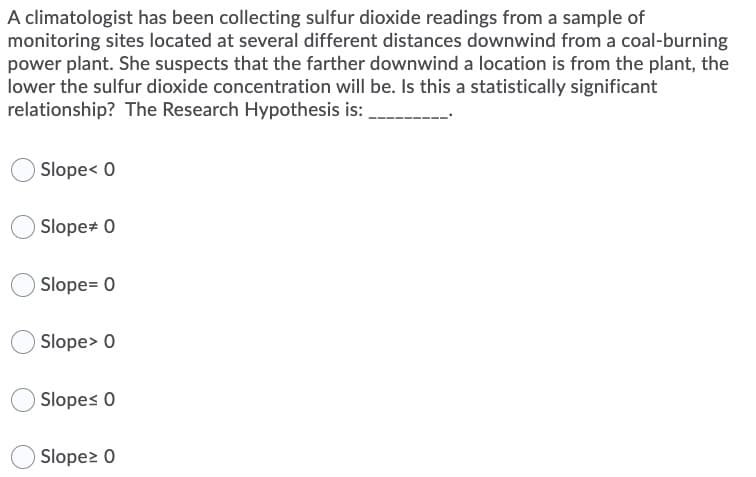
Transcribed Image Text:A climatologist has been collecting sulfur dioxide readings from a sample of
monitoring sites located at several different distances downwind from a coal-burning
power plant. She suspects that the farther downwind a location is from the plant, the
lower the sulfur dioxide concentration will be. Is this a statistically significant
relationship? The Research Hypothesis is:
O Slope< 0
Slope# 0
Slope= 0
Slope> 0
Slopes 0
Slopez 0
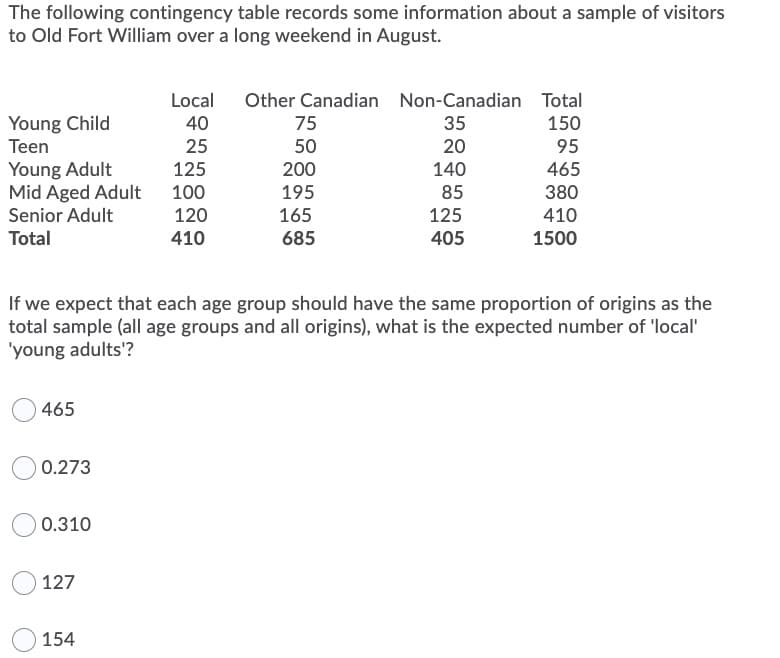
Transcribed Image Text:The following contingency table records some information about a sample of visitors
to Old Fort William over a long weekend in August.
Local
Other Canadian Non-Canadian Total
Young Child
40
75
35
150
Teen
25
50
20
95
Young Adult
Mid Aged Adult
125
200
140
465
100
195
85
380
120
125
405
Senior Adult
165
410
Total
410
685
1500
If we expect that each age group should have the same proportion of origins as the
total sample (all age groups and all origins), what is the expected number of 'local'
'young adults'?
465
0.273
0.310
127
154
Expert Solution
This question has been solved!
Explore an expertly crafted, step-by-step solution for a thorough understanding of key concepts.

Step by step
Solved in 2 steps with 2 images

Recommended textbooks for you
Glencoe Algebra 1, Student Edition, 9780079039897…
Algebra
ISBN:
9780079039897
Author:
Carter
Publisher:
McGraw Hill

Linear Algebra: A Modern Introduction
Algebra
ISBN:
9781285463247
Author:
David Poole
Publisher:
Cengage Learning

Big Ideas Math A Bridge To Success Algebra 1: Stu…
Algebra
ISBN:
9781680331141
Author:
HOUGHTON MIFFLIN HARCOURT
Publisher:
Houghton Mifflin Harcourt
Glencoe Algebra 1, Student Edition, 9780079039897…
Algebra
ISBN:
9780079039897
Author:
Carter
Publisher:
McGraw Hill
Linear Algebra: A Modern Introduction
Algebra
ISBN:
9781285463247
Author:
David Poole
Publisher:
Cengage Learning
Big Ideas Math A Bridge To Success Algebra 1: Stu…
Algebra
ISBN:
9781680331141
Author:
HOUGHTON MIFFLIN HARCOURT
Publisher:
Houghton Mifflin Harcourt