A collection of data samples is independent if they come from unrelated populations and the samples do not affect each other. Using the Kruskal-Wallis Test, we can decide whether the population distributions are identical without assuming them to follow the normal distribution. In the built-in data set named airquality, the daily air quality measurements in New York, May to September 1973, are recorded. The ozone density is presented in the data frame column Ozone. Without assuming the data to have normal distribution, test at .05 significance level if the monthly ozone density in New York has identical data distributions from May to September 1973. An R code and its output is given below. R code and its output > head (airquality) Ozone Solar.R Wind Temp Month Day 41 36 5 1 5 2 190 7.4 67 2 118 8.0 72 ..... > kruskal.test (Ozone - Month, data = airquality) Kruskal-Wallis rank sum test data: Ozone by Month Kruskal-Wallis chi-squared - 29.267, df = 4, p-value - 6.901e-06 Which of the following is the correct interpretation of the result of data analysis using R? I. At .05 significance level, we conclude that the monthly ozone density in New York from May to September 1973 are nonidentical populations. II. At .05 significance level, we conclude that the monthly ozone density in New York from May to September 1973 are identical populations. III. At .05 significance level, we conclude that the monthly ozone density in New York from May to September 1973 are not significantly different. a. I only b. П оnly c. III only d. Both II and III
A collection of data samples is independent if they come from unrelated populations and the samples do not affect each other. Using the Kruskal-Wallis Test, we can decide whether the population distributions are identical without assuming them to follow the normal distribution. In the built-in data set named airquality, the daily air quality measurements in New York, May to September 1973, are recorded. The ozone density is presented in the data frame column Ozone. Without assuming the data to have normal distribution, test at .05 significance level if the monthly ozone density in New York has identical data distributions from May to September 1973. An R code and its output is given below. R code and its output > head (airquality) Ozone Solar.R Wind Temp Month Day 41 36 5 1 5 2 190 7.4 67 2 118 8.0 72 ..... > kruskal.test (Ozone - Month, data = airquality) Kruskal-Wallis rank sum test data: Ozone by Month Kruskal-Wallis chi-squared - 29.267, df = 4, p-value - 6.901e-06 Which of the following is the correct interpretation of the result of data analysis using R? I. At .05 significance level, we conclude that the monthly ozone density in New York from May to September 1973 are nonidentical populations. II. At .05 significance level, we conclude that the monthly ozone density in New York from May to September 1973 are identical populations. III. At .05 significance level, we conclude that the monthly ozone density in New York from May to September 1973 are not significantly different. a. I only b. П оnly c. III only d. Both II and III

Glencoe Algebra 1, Student Edition, 9780079039897, 0079039898, 2018
18th Edition
ISBN:9780079039897
Author:Carter
Publisher:Carter
Chapter10: Statistics
Section10.4: Distributions Of Data
Problem 19PFA

Related questions
Question
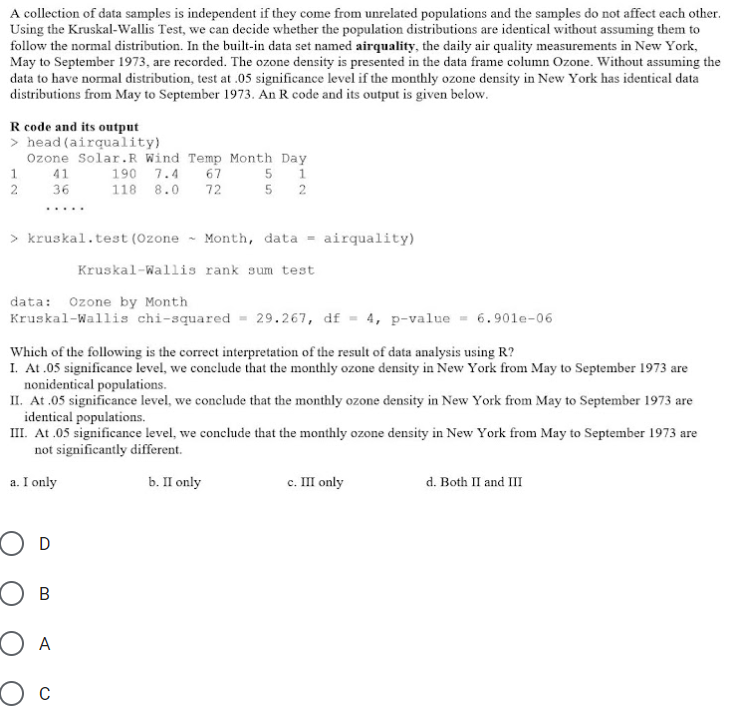
Transcribed Image Text:A collection of data samples is independent if they come from unrelated populations and the samples do not affect each other.
Using the Kruskal-Wallis Test, we can decide whether the population distributions are identical without assuming them to
follow the normal distribution. In the built-in data set named airquality, the daily air quality measurements in New York,
May to September 1973, are recorded. The ozone density is presented in the data frame column Ozone. Without assuming the
data to have normal distribution, test at .05 significance level if the monthly ozone density in New York has identical data
distributions from May to September 1973. An R code and its output is given below.
R code and its output
> head (airquality)
Ozone Solar.R Wind Temp Month Day
190 7.4 67
5 1
5 2
41
2
36
118 8.0
72
.....
> kruskal.test (Ozone - Month, data = airquality)
Kruskal-Wallis rank sum test
data: Ozone by Month
Kruskal-Wallis chi-squared = 29.267, df = 4, p-value
6.901e-06
Which of the following is the correct interpretation of the result of data analysis using R?
I. At .05 significance level, we conclude that the monthly ozone density in New York from May to September 1973 are
nonidentical populations.
II. At .05 significance level, we conclude that the monthly ozone density in New York from May to September 1973 are
identical populations.
III. At .05 significance level, we conclude that the monthly ozone density in New York from May to September 1973 are
not significantly different.
a. I only
b. П only
с. Ш only
d. Both II and III
O D
O B
O A
Expert Solution
This question has been solved!
Explore an expertly crafted, step-by-step solution for a thorough understanding of key concepts.

Step by step
Solved in 2 steps

Recommended textbooks for you
Glencoe Algebra 1, Student Edition, 9780079039897…
Algebra
ISBN:
9780079039897
Author:
Carter
Publisher:
McGraw Hill
Glencoe Algebra 1, Student Edition, 9780079039897…
Algebra
ISBN:
9780079039897
Author:
Carter
Publisher:
McGraw Hill