A college infirmary conducted an experiment to determine the degree of relief provided by three cough remedies. Each cough remedy was tried on 100 students and the accompanying data recorded. Test the hypothesis that the three cough remedies are equally effective. Use a P-value in your conclusion. Click here to view the data table. Click here to view page 1 of the table of critical values of the chi-squared distribution. Click here to view page 2 of the table of critical values of the chi-squared distribution. Identify the null and alternative hypotheses. O A. Ho: For at least one remedy, the proportions of each relief level are not the same. H,: For each remedy, the proportions of each relief level are the same. O B. Ho: For each remedy, the proportions of each relief level are the same. H,: For at least one remedy, the proportions of each relief level are not the same. O C. Ho: For at least one relief level, the proportions of each remedy are not the same. H,: For each relief level, the proportions of each remedy are the same. O D. Ho: For each relief level, the proportions of each remedy are the same. H,: For at least one relief level, the proportions of each remedy are not the same. Find the test statistic. Data Table (Round to two decimal places as needed.) Remedy 1 Remedy 2 Remedy 3 No relief 21 26 18 Some relief 64 56 54 Total relief 15 18 28
A college infirmary conducted an experiment to determine the degree of relief provided by three cough remedies. Each cough remedy was tried on 100 students and the accompanying data recorded. Test the hypothesis that the three cough remedies are equally effective. Use a P-value in your conclusion. Click here to view the data table. Click here to view page 1 of the table of critical values of the chi-squared distribution. Click here to view page 2 of the table of critical values of the chi-squared distribution. Identify the null and alternative hypotheses. O A. Ho: For at least one remedy, the proportions of each relief level are not the same. H,: For each remedy, the proportions of each relief level are the same. O B. Ho: For each remedy, the proportions of each relief level are the same. H,: For at least one remedy, the proportions of each relief level are not the same. O C. Ho: For at least one relief level, the proportions of each remedy are not the same. H,: For each relief level, the proportions of each remedy are the same. O D. Ho: For each relief level, the proportions of each remedy are the same. H,: For at least one relief level, the proportions of each remedy are not the same. Find the test statistic. Data Table (Round to two decimal places as needed.) Remedy 1 Remedy 2 Remedy 3 No relief 21 26 18 Some relief 64 56 54 Total relief 15 18 28

Glencoe Algebra 1, Student Edition, 9780079039897, 0079039898, 2018
18th Edition
ISBN:9780079039897
Author:Carter
Publisher:Carter
Chapter10: Statistics
Section: Chapter Questions
Problem 25SGR

Related questions
Topic Video
Question
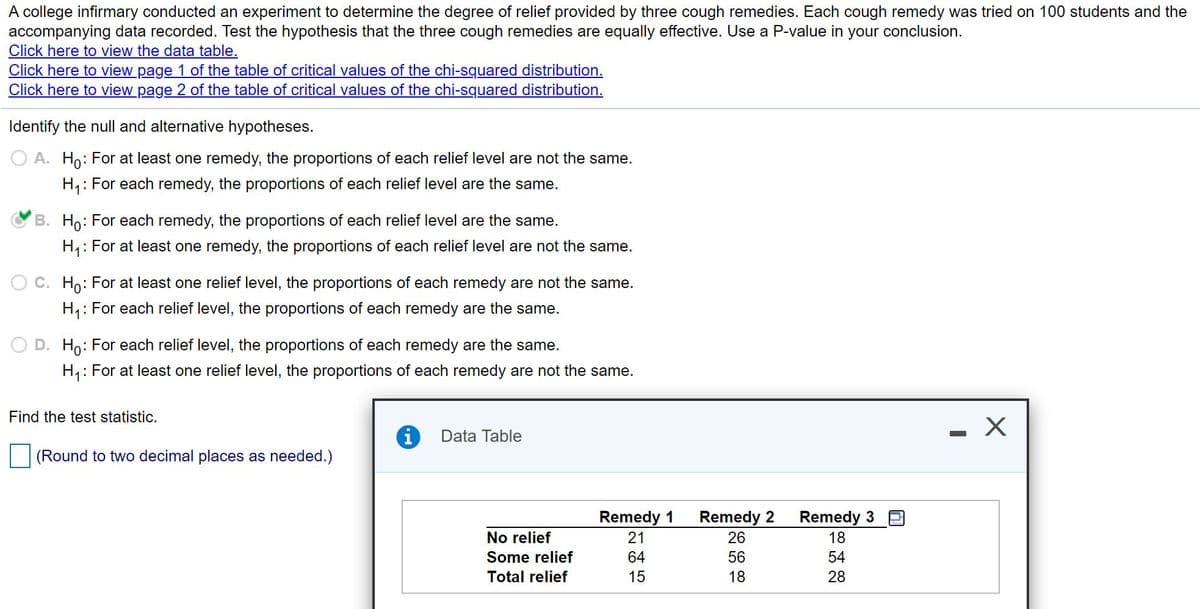
Transcribed Image Text:A college infirmary conducted an experiment to determine the degree of relief provided by three cough remedies. Each cough remedy was tried on 100 students and the
accompanying data recorded. Test the hypothesis that the three cough remedies are equally effective. Use a P-value in your conclusion.
Click here to view the data table.
Click here to view page 1 of the table of critical values of the chi-squared distribution.
Click here to view page 2 of the table of critical values of the chi-squared distribution.
Identify the null and alternative hypotheses.
O A. Ho: For at least one remedy, the proportions of each relief level are not the same.
H,: For each remedy, the proportions of each relief level are the same.
B. Ho: For each remedy, the proportions of each relief level are the same.
H,: For at least one remedy, the proportions of each relief level are not the same.
O C. Ho: For at least one relief level, the proportions of each remedy are not
same.
H,: For each relief level, the proportions of each remedy are the same.
D. Ho: For each relief level, the proportions of each remedy are the same.
H,: For at least one relief level, the proportions of each remedy are not the same.
Find the test statistic.
Data Table
(Round to two decimal places as needed.)
Remedy 1
Remedy 2
Remedy 3
No relief
21
26
18
Some relief
64
56
54
Total relief
15
18
28
Expert Solution
This question has been solved!
Explore an expertly crafted, step-by-step solution for a thorough understanding of key concepts.

This is a popular solution!

Trending now
This is a popular solution!

Step by step
Solved in 2 steps

Knowledge Booster


Learn more about
Need a deep-dive on the concept behind this application? Look no further. Learn more about this topic, statistics and related others by exploring similar questions and additional content below.Recommended textbooks for you
Glencoe Algebra 1, Student Edition, 9780079039897…
Algebra
ISBN:
9780079039897
Author:
Carter
Publisher:
McGraw Hill
Glencoe Algebra 1, Student Edition, 9780079039897…
Algebra
ISBN:
9780079039897
Author:
Carter
Publisher:
McGraw Hill