According to a study conducted by an organization, the proportion of Americans who were afraid to fly in 2006 was 0.10. A random sample of 1,200 Americans results in 108 indicating that they are afraid to fly. Explain why this is not necessarily evidence that the proportion of Americans who are afraid to fly has decreased. Click here to view the standard normal distribution table (page 1). Click here to view the standard normal distribution table (page 2). C OA. This is not necessarily evidence that the proportion of Americans who are afraid to fly has decreased below 0.10 because the probability of obtaining a value equal to or more extreme than the sample proportion is which is not unusual. (Round to four decimal places as needed.) OB. This is not necessarily evidence that the proportion of Americans who are afraid to fly has decreased below 0.10 because the sample proportion, very close to 0.10. (Type an integer or a decimal.) OC. This is not necessarily evidence that the proportion of Americans who are afraid to fly has decreased below 0.10 because the value of np(1-p) is less than 10. is OD. This is not necessarily evidence that the proportion of Americans who are afraid to fly has decreased below 0.10 because the sample size n is more than 5% of the population.
According to a study conducted by an organization, the proportion of Americans who were afraid to fly in 2006 was 0.10. A random sample of 1,200 Americans results in 108 indicating that they are afraid to fly. Explain why this is not necessarily evidence that the proportion of Americans who are afraid to fly has decreased. Click here to view the standard normal distribution table (page 1). Click here to view the standard normal distribution table (page 2). C OA. This is not necessarily evidence that the proportion of Americans who are afraid to fly has decreased below 0.10 because the probability of obtaining a value equal to or more extreme than the sample proportion is which is not unusual. (Round to four decimal places as needed.) OB. This is not necessarily evidence that the proportion of Americans who are afraid to fly has decreased below 0.10 because the sample proportion, very close to 0.10. (Type an integer or a decimal.) OC. This is not necessarily evidence that the proportion of Americans who are afraid to fly has decreased below 0.10 because the value of np(1-p) is less than 10. is OD. This is not necessarily evidence that the proportion of Americans who are afraid to fly has decreased below 0.10 because the sample size n is more than 5% of the population.

MATLAB: An Introduction with Applications
6th Edition
ISBN:9781119256830
Author:Amos Gilat
Publisher:Amos Gilat
Chapter1: Starting With Matlab
Section: Chapter Questions
Problem 1P

Related questions
Question
Pls answer in 10 minutes
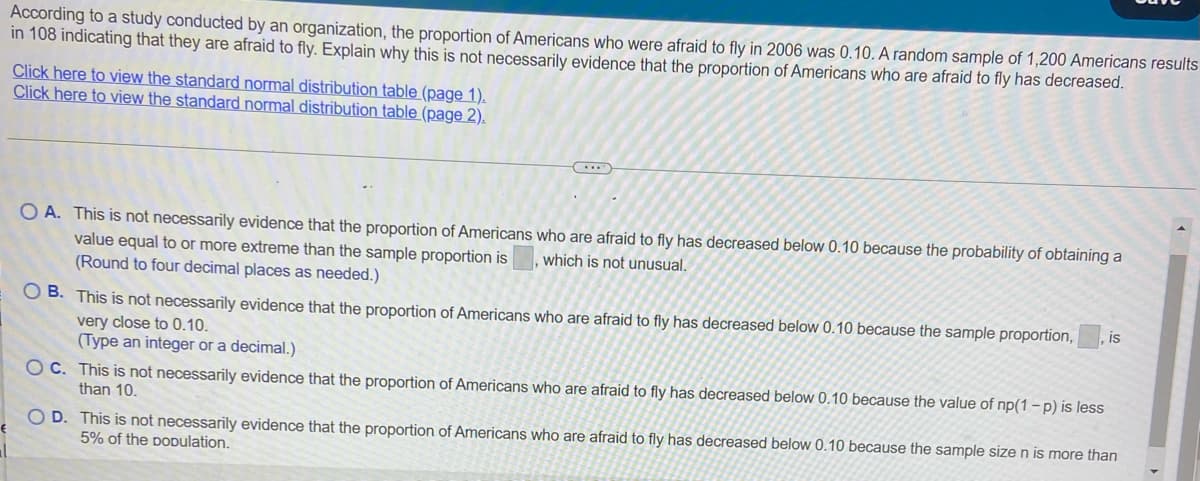
Transcribed Image Text:According to a study conducted by an organization, the proportion of Americans who were afraid to fly in 2006 was 0.10. A random sample of 1,200 Americans results
in 108 indicating that they are afraid to fly. Explain why this is not necessarily evidence that the proportion of Americans who are afraid to fly has decreased.
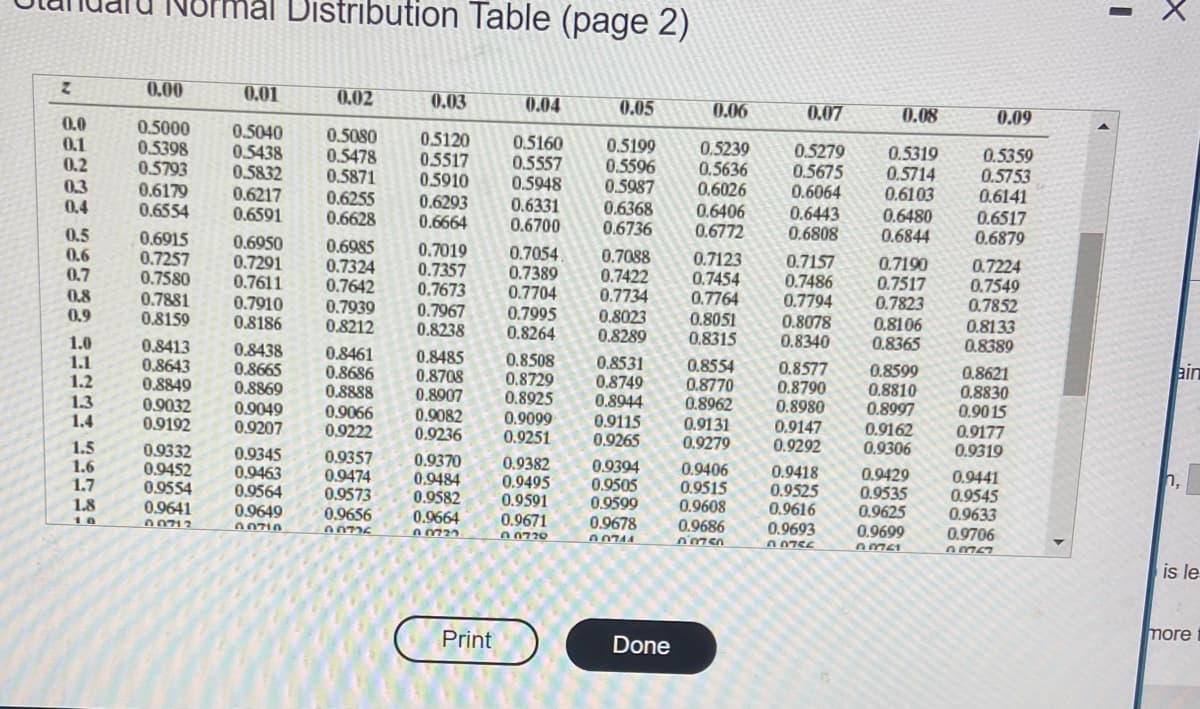
Click here to view the standard normal distribution table (page 1).
Click here to view the standard normal distribution table (page 2).
C
OA. This is not necessarily evidence that the proportion of Americans who are afraid to fly has decreased below 0.10 because the probability of obtaining a
value equal to or more extreme than the sample proportion is which is not unusual.
(Round to four decimal places as needed.)
OB. This is not necessarily evidence that the proportion of Americans who are afraid to fly has decreased below 0.10 because the sample proportion,
very close to 0.10.
(Type an integer or a decimal.)
, is
OC. This is not necessarily evidence that the proportion of Americans who are afraid to fly has decreased below 0.10 because the value of np(1-p) is less
than 10.
D. This is not necessarily evidence that the proportion of Americans who are afraid to fly has decreased below 0.10 because the sample size n is more than
5% of the population.
Transcribed Image Text:z
0.0
0.1
0.2
0.3
0.4
0.5
0.6
0.7
0.8
0.9
1.0
1.1
1.2
1.3
1.4
1.5
1.6
1.7
1.8
10
0.00
0.01
0.5000 0.5040
0.5398
0.5793
0.6179
0.6554
0.6915
0.7257
0.7580
0.7881
0.8159
0.8413
0.8643
0.8849
0.9032
0.9192
0.9332
0.9452
0.9554
0.9641
00712
0.5438
0.5832
0.6217
0.6591
0.6950
0.7291
0.7611
0.7910
0.8186
0.8438
0.8665
0.8869
0.9049
0.9207
0.9345
0.9463
0.9564
0.9649
00710
Distribution Table (page 2)
0.02
0.5080
0.5478
0.5871
0.6255
0.6628
0.6985
0.7324
0.7642
0.7939
0.8212
0.8461
0.8686
0.8888
0.9066
0.9222
0.9357
0.9474
0.9573
0.9656
00776
0.03
0.5120
0.5517
0.5910
0.6293
0.6664
0.7019
0.7357
0.7673
0.7967
0.8238
0.8485
0.8708
0.8907
0.9082
0.9236
0.9370
0.9484
0.9582
0.9664
0723
Print
0.04
0.5160
0.5557
0.5948
0.6331
0.6700
0.7054
0.7389
0.7704
0.7995
0.8264
0.8508
0.8729
0.8925
0.9099
0.9251
0.9382
0.9495
0.9591
0.9671
0720
0.05
0.5199
0.5596
0.5987
0.6368
0.6736
0.7088
0.7422
0.7734
0.8023
0.8289
0.8531
0.8749
0.8944
0.9115
0.9265
0.9394
0.9505
0.9599
0.9678
00744
Done
0.06
0.5239
0.5636
0.6026
0.6406
0.6772
0.7123
0.7454
0.7764
0.8051
0.8315
0.8554
0.8770
0.8962
0.9131
0.9279
0.9406
0.9515
0.9608
0.9686
n'men
0.07
0.5279
0.5675
0.6064
0.6443
0.6808
0.7157
0.7486
0.7794
0.8078
0.8340
0.8577
0.8790
0.8980
0.9147
0.9292
0.9418
0.9525
0.9616
0.9693
0752
0.08
0.5319
0.5714
0.6103
0.6480
0.6844
0.7190
0.7517
0.7823
0.8106
0.8365
0.8599
0.8810
0.8997
0.9162
0.9306
0.9429
0.9535
0.9625
0.9699
73761
0.09
0.5359
0.5753
0.6141
0.6517
0.6879
0.7224
0.7549
0.7852
0.8133
0.8389
0.8621
0.8830
0.90 15
0.9177
0.9319
0.9441
0.9545
0.9633
0.9706
73757
ain
1,
is le
more
Expert Solution
This question has been solved!
Explore an expertly crafted, step-by-step solution for a thorough understanding of key concepts.

Step by step
Solved in 4 steps with 3 images

Recommended textbooks for you
MATLAB: An Introduction with Applications
Statistics
ISBN:
9781119256830
Author:
Amos Gilat
Publisher:
John Wiley & Sons Inc

Probability and Statistics for Engineering and th…
Statistics
ISBN:
9781305251809
Author:
Jay L. Devore
Publisher:
Cengage Learning

Statistics for The Behavioral Sciences (MindTap C…
Statistics
ISBN:
9781305504912
Author:
Frederick J Gravetter, Larry B. Wallnau
Publisher:
Cengage Learning
MATLAB: An Introduction with Applications
Statistics
ISBN:
9781119256830
Author:
Amos Gilat
Publisher:
John Wiley & Sons Inc
Probability and Statistics for Engineering and th…
Statistics
ISBN:
9781305251809
Author:
Jay L. Devore
Publisher:
Cengage Learning
Statistics for The Behavioral Sciences (MindTap C…
Statistics
ISBN:
9781305504912
Author:
Frederick J Gravetter, Larry B. Wallnau
Publisher:
Cengage Learning

Elementary Statistics: Picturing the World (7th E…
Statistics
ISBN:
9780134683416
Author:
Ron Larson, Betsy Farber
Publisher:
PEARSON

The Basic Practice of Statistics
Statistics
ISBN:
9781319042578
Author:
David S. Moore, William I. Notz, Michael A. Fligner
Publisher:
W. H. Freeman

Introduction to the Practice of Statistics
Statistics
ISBN:
9781319013387
Author:
David S. Moore, George P. McCabe, Bruce A. Craig
Publisher:
W. H. Freeman