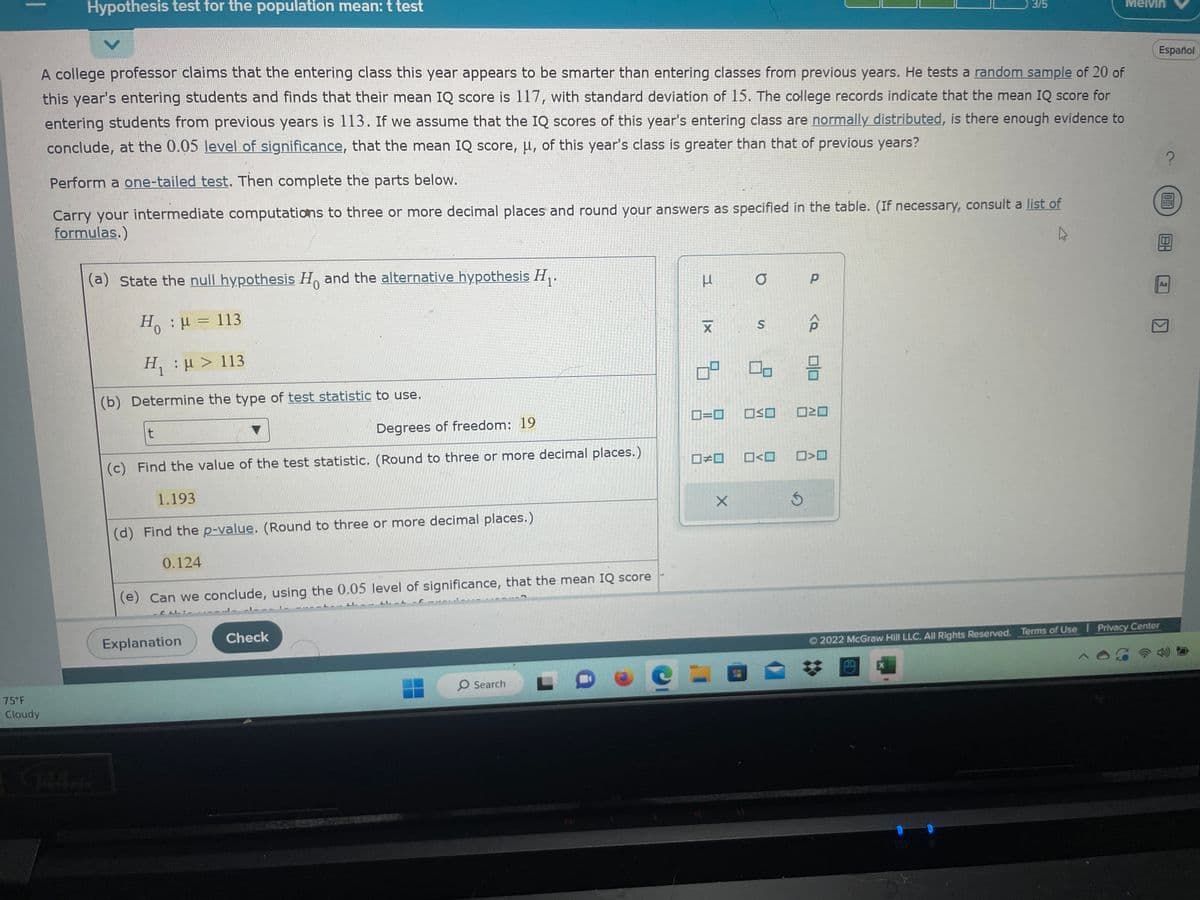
A college professor claims that the entering class this year appears to be smarter than entering classes from previous years. He tests a random sample of 20 this year's entering students and finds that their mean IQ score is 117, with standard deviation of 15. The college records indicate that the mean IQ score for entering students from previous years is 113. If we assume that the IQ scores of this year's entering class are normally distributed, is there enough evidence conclude, at the 0.05 level of significance, that the mean IQ score, μ, of this year's class is greater than that of previous years? Perform a one-tailed test. Then complete the parts below. Carry your intermediate computations to three or more decimal places and round your answers as specified in the table. (If necessary, consult a list of formulas.) 4 (a) State the null hypothesis Ho and the alternative hypothesis H₁. H: H = 113 H :μ > 113 (b) Determine the type of test statistic to use. Degrees of freedom: 19 (c) Find the value of the test statistic. (Round to three or more decimal places.) 1.193 (d) Find the p-value. (Round to three or more decimal places.) 0.124 (e) Can we conclude, using the 0.05 level of significance, that the mean IQ score Fulanation Check 3 Ix X 09 0-0 a X S O=O OSO 00 O 2022 McGraw Hill LLC. All Rights Reserved. Terms of Use Prive
A college professor claims that the entering class this year appears to be smarter than entering classes from previous years. He tests a random sample of 20 this year's entering students and finds that their mean IQ score is 117, with standard deviation of 15. The college records indicate that the mean IQ score for entering students from previous years is 113. If we assume that the IQ scores of this year's entering class are normally distributed, is there enough evidence conclude, at the 0.05 level of significance, that the mean IQ score, μ, of this year's class is greater than that of previous years? Perform a one-tailed test. Then complete the parts below. Carry your intermediate computations to three or more decimal places and round your answers as specified in the table. (If necessary, consult a list of formulas.) 4 (a) State the null hypothesis Ho and the alternative hypothesis H₁. H: H = 113 H :μ > 113 (b) Determine the type of test statistic to use. Degrees of freedom: 19 (c) Find the value of the test statistic. (Round to three or more decimal places.) 1.193 (d) Find the p-value. (Round to three or more decimal places.) 0.124 (e) Can we conclude, using the 0.05 level of significance, that the mean IQ score Fulanation Check 3 Ix X 09 0-0 a X S O=O OSO 00 O 2022 McGraw Hill LLC. All Rights Reserved. Terms of Use Prive

MATLAB: An Introduction with Applications
6th Edition
ISBN:9781119256830
Author:Amos Gilat
Publisher:Amos Gilat
Chapter1: Starting With Matlab
Section: Chapter Questions
Problem 1P

Related questions
Question
Transcribed Image Text:|
75°F
Cloudy
Hypothesis test for the population mean: t test
A college professor claims that the entering class this year appears to be smarter than entering classes from previous years. He tests a random sample of 20 of
this year's entering students and finds that their mean IQ score is 117, with standard deviation of 15. The college records indicate that the mean IQ score for
entering students from previous years is 113. If we assume that the IQ scores of this year's entering class are normally distributed, is there enough evidence to
conclude, at the 0.05 level of significance, that the mean IQ score, μ, of this year's class is greater than that of previous years?
Perform a one-tailed test. Then complete the parts below.
Carry your intermediate computations to three or more decimal places and round your answers as specified in the table. (If necessary, consult a list of
formulas.)
(a) State the null hypothesis Ho and the alternative hypothesis H₁.
H₁ : μ = 113
H₁ :μ > 113
(b) Determine the type of test statistic to use.
t
Degrees of freedom: 19
(c) Find the value of the test statistic. (Round to three or more decimal places.)
1.193
(d) Find the p-value. (Round to three or more decimal places.)
0.124
(e) Can we conclude, using the 0.05 level of significance, that the mean IQ score
Explanation
Check
----
O Search
I
XI
5
O
S
X
00
ロ=ロ OSO
□□ □<ロ
5
Р
<Q
=
3/5
NO
>O
Español
Ⓒ2022 McGraw Hill LLC. All Rights Reserved. Terms of Use | Privacy Center
?
0
BH
Expert Solution
This question has been solved!
Explore an expertly crafted, step-by-step solution for a thorough understanding of key concepts.

Step by step
Solved in 5 steps with 1 images

Recommended textbooks for you
MATLAB: An Introduction with Applications
Statistics
ISBN:
9781119256830
Author:
Amos Gilat
Publisher:
John Wiley & Sons Inc

Probability and Statistics for Engineering and th…
Statistics
ISBN:
9781305251809
Author:
Jay L. Devore
Publisher:
Cengage Learning

Statistics for The Behavioral Sciences (MindTap C…
Statistics
ISBN:
9781305504912
Author:
Frederick J Gravetter, Larry B. Wallnau
Publisher:
Cengage Learning
MATLAB: An Introduction with Applications
Statistics
ISBN:
9781119256830
Author:
Amos Gilat
Publisher:
John Wiley & Sons Inc
Probability and Statistics for Engineering and th…
Statistics
ISBN:
9781305251809
Author:
Jay L. Devore
Publisher:
Cengage Learning
Statistics for The Behavioral Sciences (MindTap C…
Statistics
ISBN:
9781305504912
Author:
Frederick J Gravetter, Larry B. Wallnau
Publisher:
Cengage Learning

Elementary Statistics: Picturing the World (7th E…
Statistics
ISBN:
9780134683416
Author:
Ron Larson, Betsy Farber
Publisher:
PEARSON

The Basic Practice of Statistics
Statistics
ISBN:
9781319042578
Author:
David S. Moore, William I. Notz, Michael A. Fligner
Publisher:
W. H. Freeman

Introduction to the Practice of Statistics
Statistics
ISBN:
9781319013387
Author:
David S. Moore, George P. McCabe, Bruce A. Craig
Publisher:
W. H. Freeman