A common way to analyze count or frequency (e.g., number of head or tails) data is with a chi- square test. The chi-square test is used in all fields of science to determine if there is a difference between one set of data with obser

College Algebra
1st Edition
ISBN:9781938168383
Author:Jay Abramson
Publisher:Jay Abramson
Chapter9: Sequences, Probability And Counting Theory
Section9.7: Probability
Problem 1SE: What term is used to express the likelihood of an event occurring? Are there restrictions on its...
icon
Related questions
Question

A common way to analyze count or frequency (e.g., number of head or tails) data is with a chi-
square test. The chi-square test is used in all fields of science to determine if there is a difference
between one set of data with observations that are grouped into two or more categories (e.g.,
heads or tails) and the expected number of observations in each category. The null hypothesis
would be that the number of heads and tails are not different than one another (similar numbers
of heads and tails are observed relative to expected). A large Chi-square value relative to the
Chi-square critical value would result in a small p value (p<0.05) and indicate that there were
more heads than tails indicating little support for the null hypothesis.
The formula for calculating a chi-square test is below.
Watch the following video for help: https://youtu.be/PnfpWBduB-A
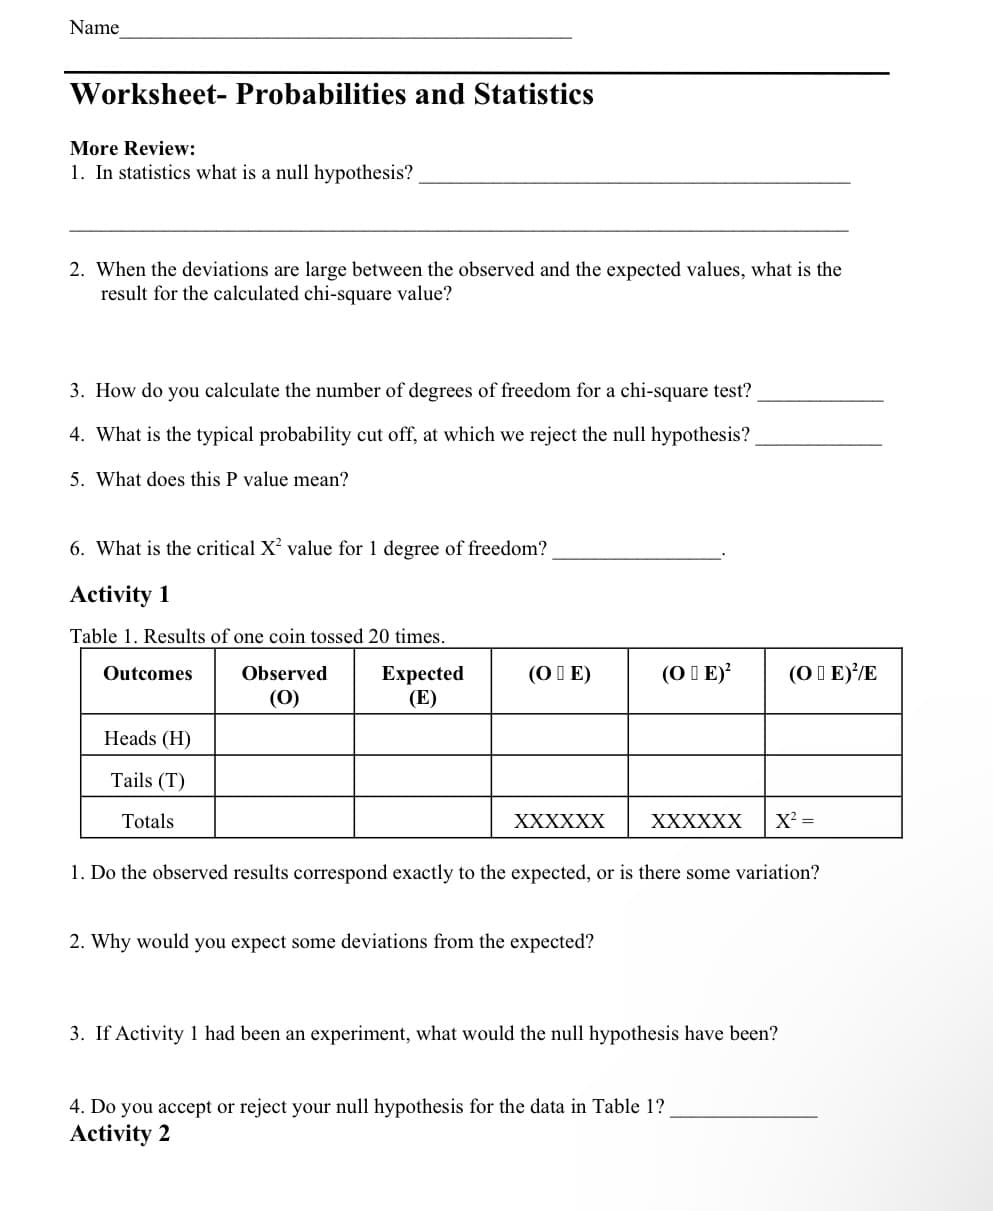
Activity 1 You will need one coin for this activity.
1. Toss a single coin 20 times, recording the number of times the coin lands on "heads" and
"tails" in the Observed Number (O) column of Table 1 on the Worksheet page.
2. Calculate and record the Expected Number (E) in Table 1. The expected number is always
equal to the probability of the event (P) multiplied by the total number of trials.
3. Calculate and record in Table 1 the deviations from the expected; i.e., O  E.
Below are two more activities and their respective tables are on the Worksheet page. After
completing the activities, fill in the tables and answer the associated questions.
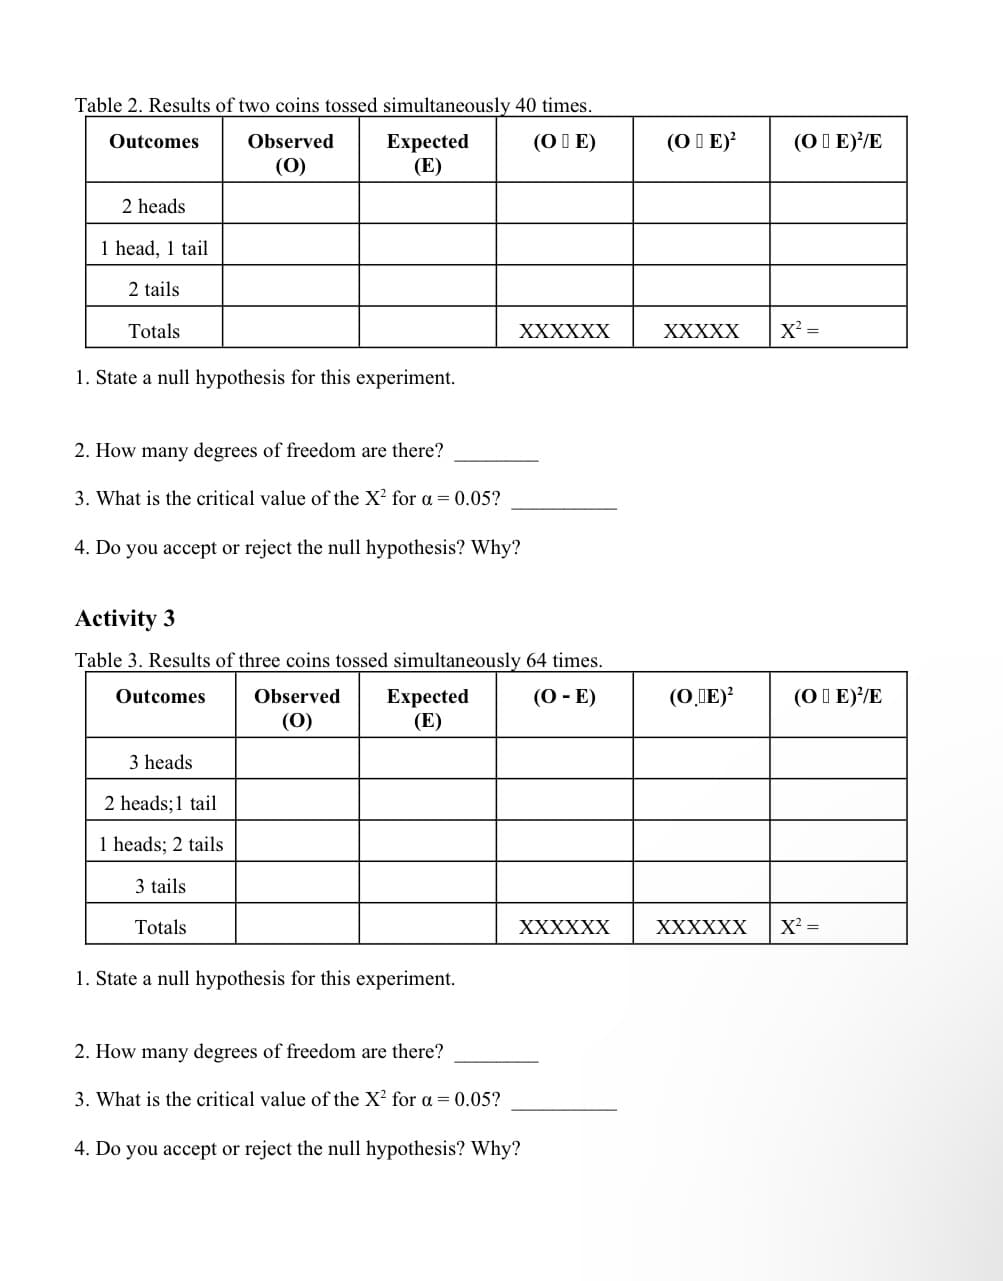
Activity 2 You will need two coins for this activity.
1. Toss two coins together 40 times, recording the observed combinations in Table 2.
2. Calculate and record the expected number of each combination in Table 2.
3. Calculate and record the deviations from the expected in Table 2.
Activity 3 You will need three coins for this activity.
1. Toss three coins together 64 times and record the observed combinations in Table 3.
2. Calculate and record the expected number of each combination in Table 3.
3. Calculate and record the deviations from the expected in Table 3.

Table 2. Results of two coins tossed simultaneously 40 times.
Outcomes
(OE)
Observed
(0)
2 heads
1 head, 1 tail
2 tails
Totals
1. State a null hypothesis for this experiment.
Expected
(E)
2. How many degrees of freedom are there?
3. What is the critical value of the X2 for a = 0.05?
4. Do you accept or reject the null hypothesis? Why?
3 heads
2 heads; 1 tail
1 heads; 2 tails
3 tails
Activity 3
Table 3. Results of three coins tossed simultaneously 64 times.
Outcomes
(O - E)
Totals
XXXXXX
Observed Expected
(0)
(E)
1. State a null hypothesis for this experiment.
XXXXXX
2. How many degrees of freedom are there?
3. What is the critical value of the X² for a = 0.05?
4. Do you accept or reject the null hypothesis? Why?
(OE)²
XXXXX
(O.DE)²
XXXXXX
(OE)²/E
X² =
(OE)²/E
X² =
Transcribed Image Text:Table 2. Results of two coins tossed simultaneously 40 times. Outcomes (OE) Observed (0) 2 heads 1 head, 1 tail 2 tails Totals 1. State a null hypothesis for this experiment. Expected (E) 2. How many degrees of freedom are there? 3. What is the critical value of the X2 for a = 0.05? 4. Do you accept or reject the null hypothesis? Why? 3 heads 2 heads; 1 tail 1 heads; 2 tails 3 tails Activity 3 Table 3. Results of three coins tossed simultaneously 64 times. Outcomes (O - E) Totals XXXXXX Observed Expected (0) (E) 1. State a null hypothesis for this experiment. XXXXXX 2. How many degrees of freedom are there? 3. What is the critical value of the X² for a = 0.05? 4. Do you accept or reject the null hypothesis? Why? (OE)² XXXXX (O.DE)² XXXXXX (OE)²/E X² = (OE)²/E X² =
Name
Worksheet- Probabilities and Statistics
More Review:
1. In statistics what is a null hypothesis?
2. When the deviations are large between the observed and the expected values, what is the
result for the calculated chi-square value?
3. How do you calculate the number of degrees of freedom for a chi-square test?
4. What is the typical probability cut off, at which we reject the null hypothesis?
5. What does this P value mean?
6. What is the critical X² value for 1 degree of freedom?
Activity 1
Table 1. Results of one coin tossed 20 times.
Outcomes
Observed
Expected
(E)
(0)
Heads (H)
Tails (T)
Totals
(OIE)
XXXXXX
(OE)² (OE)//E
2. Why would you expect some deviations from the expected?
XXXXXX X² =
1. Do the observed results correspond exactly to the expected, or is there some variation?
3. If Activity 1 had been an experiment, what would the null hypothesis have been?
4. Do you accept or reject your null hypothesis for the data in Table 1?
Activity 2
Transcribed Image Text:Name Worksheet- Probabilities and Statistics More Review: 1. In statistics what is a null hypothesis? 2. When the deviations are large between the observed and the expected values, what is the result for the calculated chi-square value? 3. How do you calculate the number of degrees of freedom for a chi-square test? 4. What is the typical probability cut off, at which we reject the null hypothesis? 5. What does this P value mean? 6. What is the critical X² value for 1 degree of freedom? Activity 1 Table 1. Results of one coin tossed 20 times. Outcomes Observed Expected (E) (0) Heads (H) Tails (T) Totals (OIE) XXXXXX (OE)² (OE)//E 2. Why would you expect some deviations from the expected? XXXXXX X² = 1. Do the observed results correspond exactly to the expected, or is there some variation? 3. If Activity 1 had been an experiment, what would the null hypothesis have been? 4. Do you accept or reject your null hypothesis for the data in Table 1? Activity 2
Expert Solution
steps

Step by step

Solved in 3 steps

Blurred answer
Recommended textbooks for you
College Algebra
College Algebra
Algebra
ISBN:
9781938168383
Author:
Jay Abramson
Publisher:
OpenStax