A. What is the p-value of your test? a. 0.0113 b. 0.9887 c. 0.0226 B. What is your estimate for the true difference between the weights of these populations? a. 0 b. 7.08 c. 6.26 d. 0.82 C. Based on a 99% confidence interval, would you have rejected your null hypothesis at t he alpha = 0.01 level? a. No answer text provided. b. Yes, we would have rejected the null hypothesis. c. No answer text provided. d. No, we would not have rejected the null hypothesis.
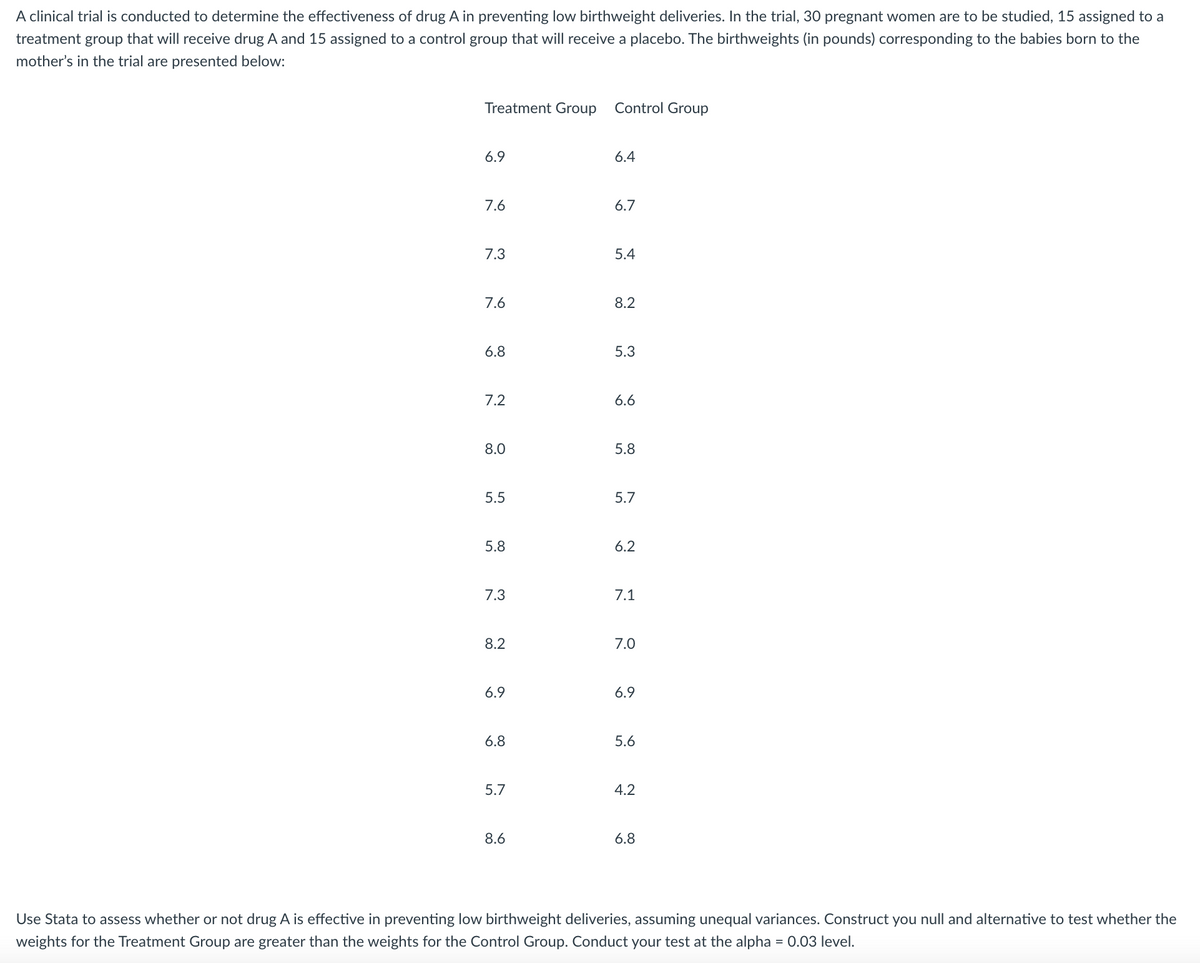
Q: 7.5.11. Let X₁, X₂,..., Xn, n > 2, be a random sample from the binomial distri- bution b(1,0). 440…
A: Since you have posted a question with multiple sub parts, according to our guidelines we can solve…
Q: Discuss the two forms of the regression equation, raw score and z score, and their verbal…
A:
Q: Assume that adults have IQ scores that are normally distributed with a mean of μ=105 and a standard…
A: given data normal distriutionμ= 105σ = 15P(90<x<120) = ?
Q: Suppose that the continuous random variable X has cumulative distribution function given by F(x)=…
A: Given that, X is a continuous random variable. X has a cumulative distribution function Fx. Fx is…
Q: Educational Television In a random sample of 195 people, 156 said that they watched educational…
A: Givensample size(n)=195x=156p^=xn=156195=0.8confidence level=95%
Q: Giving a test to a group of students, the table below summarizes the grade earned by gender. Male…
A: Answer:- Given, the table below A B C Total Male 3 6 9 18 Female 16 10 7 33…
Q: Suppose that x has a distribution with μ-9 and 0-4 and it is normally distributed (bell shaped). If…
A: It is given that the random variable X has a distribution with μ = 9 and σ = 4 and it is normally…
Q: What type of test (t-test or ANOVA) should be run for the following studies? For a t-test, indicate…
A: T test is used to test for the population mean differences between one or two populations. While…
Q: Find the value of zo. ZO.29 20.29 (Round to two decimal places as needed.)
A: The given probability is 0.29.
Q: A magazine collected the ratings for food, decor, service and the cost per person for a sample of…
A: The given model is Y^i=-25.002+1.0004Xi.
Q: A machine is designed to fill 16-ounce bottles of shampoo. When the machine is working properly, the…
A: Given information- Population mean, µ = 16.05 ounces Population standard deviation, σ = 0.3005…
Q: The mean SAT score in mathematics is 528. The standard deviation of these scores is 48. A special…
A: The sample size is 90, sample mean is 532, population mean is 528, and population standard deviation…
Q: In a recent tennis tournament, women playing singles matches used challenges on 136 calls made by…
A: We have given thatn = 136x = 38p̂ = x/n = 38/136 = 0.2794Significance level (α) = 1 - 0.99 =…
Q: A federal report indicated that 28% of children under age 6 live in pove in Kentucky, an increase…
A: Given,margin of error(E)=0.01sample proportion(p^)=0.28α=1-0.99=0.01α2=0.005Z0.005=2.5758
Q: Fast-Food Bills for Drive-Thru Customers A random sample of 46 cars in the drive-thru of a popular…
A: Given,sample size(n)=46sample mean(x¯)=19.20population standard…
Q: The living spaces of all homes in a city have a mean of 2150 square feet and a standard deviation of…
A: given data μ=2150σ=400n=50find the mean of the sampling distribution of x=?
Q: are summary statistics for randomly selected weights of newborn girls: n=234, x=30.4 hg, s=7.9…
A: given datan=234x=30.4s=7.9CI=0.98α=1-0.98=0.02
Q: for the above i got the mean of 1, can you help me w the standard deviation and the variance
A: From the above parts Here we have Since, X ~ Binomial (n = 3 , p = 1/3) Therefore, n = 3 , p = 1/3…
Q: 65. Scholarship Examination Scores. At Western University the historical mean of scholarship…
A:
Q: Write the integer that represents the situation. The temperature was 24°F. It dropped so that the…
A: Given Upper =24°F and lower=0°F
Q: The results of a national survey showed that on average, adults sleep 7.3 hours per night. Suppose…
A: Given that Mean = M = 7.3 , Standard deviation = SD = 2
Q: Fill in the P (X=x) values to give a legitimate probability distribution for the discrete random…
A: To be a legitimate probability distribution, there must be two conditions to satisfy 1.…
Q: Our neighbors have 5 children; 2 girls and 3 boys (one more on the way-gender not yet revealed). How…
A:
Q: Use the sample data and confidence level given below to complete parts (a) through (d). A drug is…
A: Introduction: Denote p as the true population proportion of patients showing adverse reactions after…
Q: around social and environmental considerations. Refer to the Business and Society (March 2011) study…
A: b. Suppose µ is the population mean level of support for all senior managers at CPA firms.
Q: Engineers want to design seats in commercial aircraft so that they are wide enough to fit 90% of all…
A: GIVEN DATA μ = 14.3σ = 0.9find P90 = ?
Q: For the standard normal probability distribution, the area to the right of the mea O a 1. O b. 3.09.…
A: Given, the right area of the standard normal distribution.
Q: An airliner carries 100 passengers and has doors with a height of 74 in. Heights of men are normally…
A: given data door height = 74 in. height of men: normal distributionμ = 69.0σ = 2.8
Q: ege claims that the proportion, p, of students who commute more than fifteen miles to school is less…
A: Given that Sample size n =265 Favorable cases x =36 Sample proportion p^=x/n =36/265 =0.1358…
Q: You are asked to select a password that consists of 5 characters. Each of the characters can be any…
A: It is given that a password consists of 5 characters, each characters can be any of the capital…
Q: A food safety guideline is that the mercury in fish should be below 1 part per million (ppm).…
A: Solution-: Given data: 0.54, 0.78, 0.09, 0.94, 1.29, 0.58, 0.92 What is the confidence interval…
Q: Suppose that the efficacy of a certain drug is 0.46. Consider the sampling distribution (sample size…
A:
Q: A sample of 50 luxury hotels in the Northeast had an average room rate of $325 per night and a…
A: Introduction: It is required to identify the correct interpretations of the 95% confidence interval.
Q: Set up null and alternative hypotheses to try to determine whether there is a difference in ad…
A:
Q: Given in the table are the BMI statistics for random samples of men and women. Assume that the two…
A: Given that n 43 43 x 27.8457 26.4471 s 8.895213 5.255631
Q: According to a recent research, 13% of people living in a city has experienced COVID-19 related…
A: 13% of people living in a city has experienced COVID-19 , N= 100 p= 0.13 q = 1-p = 0.87 ( 87 people…
Q: QUESTION 8 For any continuous random variable, the probability that the random variable takes a…
A: Formula: Probability( p)lies between 0 to 1 I.e. 0 <p<1, and sum of all probability is 1
Q: Cost of Pizzas A pizza shop owner wishes to find the 90% confidence interval of the true mean cost…
A:
Q: Casper is studying intelligence, and reports that IQ scores have a µ = 100 and σ = 15. One of her…
A:
Q: I don't understand with the numbers clutter together
A: Virginia 35 Maryland 28 Delaware 23 Total residents = 86 Two people are chosen
Q: Among college students, the proportion p who say they're interested in their congressional…
A: Given data: Significance level = 0.05
Q: QUESTION 16 A simple random sample of 100 observations was taken from a large population. The sample…
A: given data n = 100 x¯ = 50s = 5find standard error of mean(σx¯) = ?
Q: Use the following contingency B 35 35 70 1 2 Total 1 2 A 10 35 45 table to complete (a) and (b)…
A: The expected frequencies are calculated by using the following formula:
Q: The mean birthweight of an infant is thought to be associated with the smoking status of the mother…
A: The number of groups is 4.
Q: A data set includes 103 body temperatures of healthy adult humans having a mean of 98.5°F and a…
A: Solution-: Given: x¯=98.5,n=103,σ=0.61,c=0.99 We want to find (a) The confidence interval estimate…
Q: John's math course requires 5 tests. His first 4 grades were 72, 89, 91, and 93. To end up with an…
A:
Q: A normal probability distribution a. can have mean of any numerical value. O b. needs to have a mean…
A:
Q: Carlos buys a bax of doughnuts. The box contains 9 chocolate glazed, 5 Boston crème, and 7 powdered…
A: Total doughnuts = 21 Chocolate glazed = 9 Boston creme = 5 Powered sugar= 7
Q: When a statistic is used to estimate a parameter, it is referred to as an _________
A: The question is about inference Introduction : Statistic is quantity which is found using a sample…
Q: The test scores of 20 students are listed below. Find the 34th percentile. 36 56 67 85 45 49 59 61…
A: Option A
A. What is the p-value of your test?
B. What is your estimate for the true difference between the weights of these populations?
Trending now
This is a popular solution!
Step by step
Solved in 3 steps with 1 images
- A heart study objective was to study heart disease among healthy volunteers.After a 10-year follow-up period involving men aged 40 to 59, there were 16 casesof coronary heart disease (CHD) among the 454 men who initially had cholesterollevels below 210 mg/100 ml (referred to as the low serum cholesterol group). Incontrast, among the 424 men whose initial cholesterol levels were at least 245mg/100 ml (referred to as the high serum cholesterol group), there were 51 cases ofCHD. With this information, Draw a 2x2 contingency table then calculate the relative risk (RR) associated with high serum cholesterol and provide an interpretation of the result.Suppose a researcher is interested inthe effectiveness in a new childhood exercise program implemented in a SRS of schools across a particular county. In order to test the hypothesis that the new program decreases BMI (Kg/m2), the researcher takes a SRS of children from schools where the program is employed and a SRS from schools that do not employ the program and compares the results. Assume the following table represents the SRSs of students and their BMIs. Student intervention group BMI (kg/m2) Student control group BMI (kg/m2) A 18.6 A 21.6 B 18.2 B 18.9 C 19.5 C 19.4 D 18.9 D 22.6 E 24.1 F 23.6 A) Assuming that all the necessary conditions are met (normality, independence, etc.) carry out the appropriate statistical test to determine if the new exercise program is effective. Use an alpha level of 0.05. Do not assume equal variances.B) Construct a 95% confidence interval about your estimate for the average difference in BMI between the groups.A paper in the Journal of Nervous and Mental Disorders reported the following data on the amount of dextroamphetamine excreted by a sample of children having organically related disorders and a sample of children with nonorganic disorders (dextroamphetamine is a drug commonly used to treat hyperkinetic children). Organic: 17.53, 20.60, 17.62, 28.93, 27.10 Nonorganic: 15.59, 14.76, 13.32, 12.45, 12.79 (Observations refer to percentage of recovery of the drug seven hours after its administration.) If we assume that the variances of the two groups of children are unequal, determine whether the true average percentages of recovery for the two conditions are equal at significance level 0.01
- To evaluate the coagulation effects of three drugs, 30 healthy volunteers were randomly assigned into 3 groups and injected with different drugs. Their relevant coagulation times were measured as follows A(group=1): 36.8 34.4 34.3 35.7 33.2 31.1 34.3 29.8 35.4 31.2B(group=2): 40.0 35.5 36.7 39.3 40.1 36.8 33.4 38.3 38.4 39.8C(group=3): 32.9 37.9 30.5 31.1 34.7 37.6 40.2 38.1 32.4 35.6Questions: ① If you want to evaluate whether the coagulation effects of the three drugs are different, which method should be used? and what are the model assumptionsfor the application of this method?② Compare the difference of the coagulation effects among three drugs by SPSS,present the main results and make interpretation.③ Make pairwise comparisons of the efficacy of the three drugs, write out the method of pairwise comparison you adopted (just write one method) and the corresponding p-values.To determine a target audience for a new email package, a computer company surveyed a large random sample of potential customers, asking each whether he/she uses email on a regular basis. (The company considered "a regular basis" to be at least three times a week.) The data, as summarized in the contingency table below, were classified according to two variables: the age of the respondent ("under 18", "18-35", "36-54", "55+") and regularity of email use ("on a regular basis" or "not on a regular basis"). Each cell of the table contains three numbers: the first number is the observed cell frequency (fO); the second number is the expected cell frequency (fE) under the assumption that there is no dependence between age and regularity of email use and the third number is the following value.To determine a target audience for a new email package, a computer company surveyed a large random sample of potential customers, asking each whether he/she uses email on a regular basis. (The company considered "a regular basis" to be at least three times a week.) The data, as summarized in the contingency table below, were classified according to two variables: the age of the respondent ("under 18", "18-35", "36-54", "55+") and regularity of email use ("on a regular basis" or "not on a regular basis"). Each cell of the table contains three numbers: the first number is the observed cell frequency (fO); the second number is the expected cell frequency (fE) under the assumption that there is no dependence between age and regularity of email use and the third number is the following value. =−fOfE2fE−Observed cell frequencyExpected cell frequency2Expected cell frequency
- An automotive engineer is investigating two different types of metering devices for an electronic fuel injection system to determine whether they differ in their fuel mileage performance. The system is installed on 10 different cars, and a test is run with each metering device on each car. The data is provided below: Metering Device Car 1 2 1 17.6 16.8 2 19.4 20.0 3 18.2 17.6 4 17.1 16.4 5 15.3 16.0 6 15.9 15.9 7 16.3 16.5 8 18.0 18.4 9 17.3 16.4 10 19.1 20.1 Is there a significant difference between the means of the two metering devices? Use . Interpret the result in the context of the problem. An article in the journal Hazardous Waste and Hazardous Materials (Vol. 6, 1989) reported the results of an analysis of the weight of calcium in standard cement and cement doped with lead. Reduced levels of calcium would indicate that the hydration mechanism in the cement is blocked…A sociologist wants to investigate the question, "Is there a relationship between texting during class and grade-point-average (GPA) among high school seniors in a large district?" Which study design is most appropriate? Before the semester starts, randomly select 40 seniors from each high school who do not text during class. Assign 20 to the texting treatment group (text three or more times during every class meeting) and 20 to the control group (no texting during class). At the end of the semester, obtain each student’s GPA from the appropriate admissions and records office. Compare the GPA of students who routinely text during class to the GPA of students who do not text during class. Before the semester starts, randomly select 40 seniors from each high school who do not text during class. Assign 20 to the texting treatment group (text three or more times during every class meeting) and 20 to the control group (no texting during class). At the end of the semester,…A psychologist at a private mental hospital was asked to determine whether there was a clear difference in the length of stay for patients with different categories of diagnosis. Looking at the last four patients in each of the three major categories, the results (in terms of weeks of stay) were as follows: Diagnosis Category Affective Disorders Cognitive Disorders Drug-Related Conditions 7 12 8 6 8 10 5 9 12 6 11 10 Using alpha = 0.05, is there a significant difference in length of stay among diagnosis categories? Show all five steps of hypothesis testing. For additional practice, compute the means and standard deviations for each group. What is the purpose of a post hoc test? What does it tell us? Explain why we do not need a post hoc test if there are only two groups in our study. Conduct Tukey's HSD post hoc test to determine where there is a difference in the three groups.
- A psychologist at a private mental hospital was asked to determine whether there was a clear difference in the length of stay for patients with different categories of diagnosis. Looking at the last four patients in each of the three major categories, the results (in terms of weeks of stay) were as follows: Diagnosis Category Affective Disorders Cognitive Disorders Drug-Related Conditions 7 12 8 6 8 10 5 9 12 6 11 10 Using alpha = 0.05, is there a significant difference in length of stay among diagnosis categories? Show all five steps of hypothesis testing and compute the means and standard deviations for each group.Researchers are interested in the effectiveness of a new anti-retroviral medication at increasing 5 year survival for HIV infected persons with Hepatitis C. In order to test the efficacy of the new study drug, the researchers randomly assigned participants to receive either the new medication or a placebo. The following table summarizes preliminary results of the trial. Deceased Non-Deceased Total New Vaccine 55 84 139 Placebo 61 67 128 Total 116 151 267 A) Calculate the relative risk for mortality among those treated with the new vaccine versus the placebo. B) Interpret the relative risk measurement.The Diabetes Control and Complications trial research group, randomly assigned volunteers with type 1 (insulin-dependent) diabetes mellitus, but without retinopathy, either to a conventional treatment or to a more intensive treatment aimed at maintaining normal blood glucose levels. The volunteers' health was monitored closely for approximately six years. By the end of the study, 91 patients out of 378 in the conventional treatment group had developed retinopathy, whereas 23 out of 348 in the intensive treatment group had developed retinopathy. Test whether the rates of retinopathy differed significantly between the two treatment groups, if they did, which rate was significantly lower. 1. Provide the null hypothesis 2. Provide the alternative hypotheses 3. calculate the appropriate test statistic. Show all work 4. Identify the p-value for that test statistic 5. Using the p-value method and an alpha level of 0.02 state what your conclusions are regarding the null hypothesis, and…