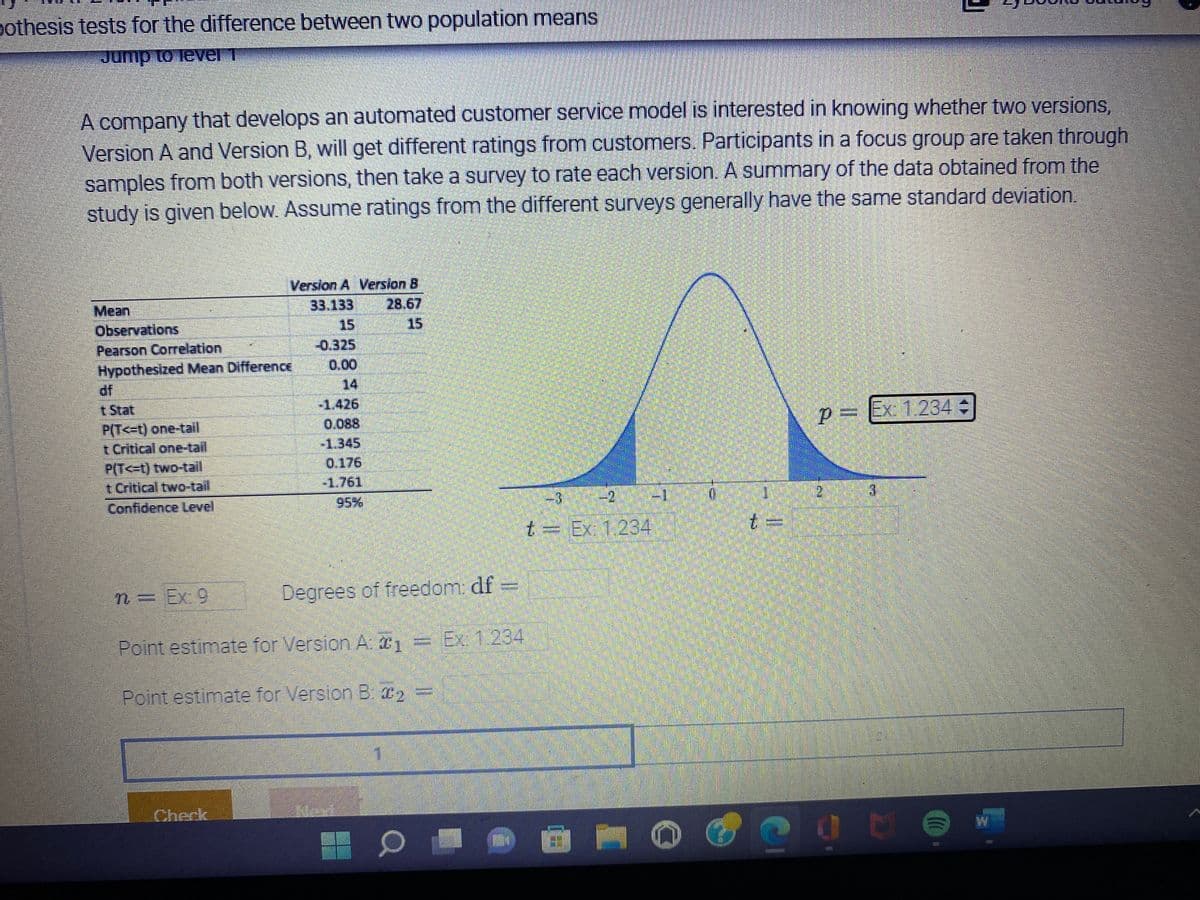
A company that develops an automated customer service model is interested in knowing whether two versions, Version A and Version B, will get different ratings from customers. Participants in a focus group are taken through samples from both versions, then take a survey to rate each version. A summary of the data obtained from the study is given below. Assume ratings from the different surveys generally have the same standard deviation. Version A Version B Mean 33.133 28.67 15 15 Observations Pearson Correlation Hypothesized Mean Difference -0.325 0.00 df 14 t Stat -1.426 P(T<=t) one-tail 0.088 P= Ex: 1.234 t Critical one-tail -1.345 P(T<=t) two-tail 0.176 -1.761 t Critical two-tail Confidence Level 95% -3 -2 -1 3 t = Ex: 1.234 n = Ex: 9 Degrees of freedom: df = Point estimate for Version A: 1 = Ex: 1234 Point estimate for Version B: X₂ = 0 1 t=
A company that develops an automated customer service model is interested in knowing whether two versions, Version A and Version B, will get different ratings from customers. Participants in a focus group are taken through samples from both versions, then take a survey to rate each version. A summary of the data obtained from the study is given below. Assume ratings from the different surveys generally have the same standard deviation. Version A Version B Mean 33.133 28.67 15 15 Observations Pearson Correlation Hypothesized Mean Difference -0.325 0.00 df 14 t Stat -1.426 P(T<=t) one-tail 0.088 P= Ex: 1.234 t Critical one-tail -1.345 P(T<=t) two-tail 0.176 -1.761 t Critical two-tail Confidence Level 95% -3 -2 -1 3 t = Ex: 1.234 n = Ex: 9 Degrees of freedom: df = Point estimate for Version A: 1 = Ex: 1234 Point estimate for Version B: X₂ = 0 1 t=

Glencoe Algebra 1, Student Edition, 9780079039897, 0079039898, 2018
18th Edition
ISBN:9780079039897
Author:Carter
Publisher:Carter
Chapter10: Statistics
Section10.4: Distributions Of Data
Problem 19PFA

Related questions
Question
Transcribed Image Text:bothesis tests for the difference between two population means
Jump to level T
A company that develops an automated customer service model is interested in knowing whether two versions,
Version A and Version B, will get different ratings from customers. Participants in a focus group are taken through
samples from both versions, then take a survey to rate each version. A summary of the data obtained from the
study is given below. Assume ratings from the different surveys generally have the same standard deviation.
Version A Version B
Mean
33.133
28.67
Observations
Pearson Correlation
-0.325
Hypothesized Mean Difference
0.00
-1.426
P(T<-t) one-tail
0.088
PEx: 1.234 +
t Critical one-tail
P(T<t) two-tail
0.176
It Critical two-tail
-1.761
Confidence Level
95%
3
-2
3
t Ex: 1.234
n= Ex 9
Degrees of freedom: df =
Point estimate for Version A: ₁
Ex: 1234
Point estimate for Version B. ₂ =
1
1
Check
TE
ES
T
0
t=
1
THOT
2
Expert Solution
This question has been solved!
Explore an expertly crafted, step-by-step solution for a thorough understanding of key concepts.

This is a popular solution!

Trending now
This is a popular solution!

Step by step
Solved in 2 steps

Follow-up Questions
Read through expert solutions to related follow-up questions below.
Recommended textbooks for you
Glencoe Algebra 1, Student Edition, 9780079039897…
Algebra
ISBN:
9780079039897
Author:
Carter
Publisher:
McGraw Hill
Glencoe Algebra 1, Student Edition, 9780079039897…
Algebra
ISBN:
9780079039897
Author:
Carter
Publisher:
McGraw Hill