A company that develops an automated customer service model is interested in knowing whether two versions, Version A and Version B, will get different ratings from customers. Participants in a focus group are taken through samples from both versions, then take a survey to rate each version. A summary of the data obtained from the study is given below. Assume ratings from the different surveys generally have the same standard deviation. Version A Version B Mean 39.333 34.4 15 15 Observations Pearson Correlation -0.011 Hypothesized Mean Difference df t Stat P(T<=t) one-tail P = 0.176 t Critical one-tail P(T<=t) two-tail t Critical two-tail Confidence Level -1 3 -3 -2 t=-1.426 n = 15 Point estimate for Version AT 0 14 -2.086 0.028 -2.624 0.056 -2.977 99% Degrees of freedom: df = 14 33 122 0 t=1.426
A company that develops an automated customer service model is interested in knowing whether two versions, Version A and Version B, will get different ratings from customers. Participants in a focus group are taken through samples from both versions, then take a survey to rate each version. A summary of the data obtained from the study is given below. Assume ratings from the different surveys generally have the same standard deviation. Version A Version B Mean 39.333 34.4 15 15 Observations Pearson Correlation -0.011 Hypothesized Mean Difference df t Stat P(T<=t) one-tail P = 0.176 t Critical one-tail P(T<=t) two-tail t Critical two-tail Confidence Level -1 3 -3 -2 t=-1.426 n = 15 Point estimate for Version AT 0 14 -2.086 0.028 -2.624 0.056 -2.977 99% Degrees of freedom: df = 14 33 122 0 t=1.426

Chapter6: Systems Of Equations And Inequalities
Section: Chapter Questions
Problem 17PS: Cholesterol Cholesterol in human blood is necessary, but too much can lead to health problems. There...

Related questions
Question
Transcribed Image Text:rary > MAT 240: Applied Statistics home >
pothesis tests for the difference between two population means
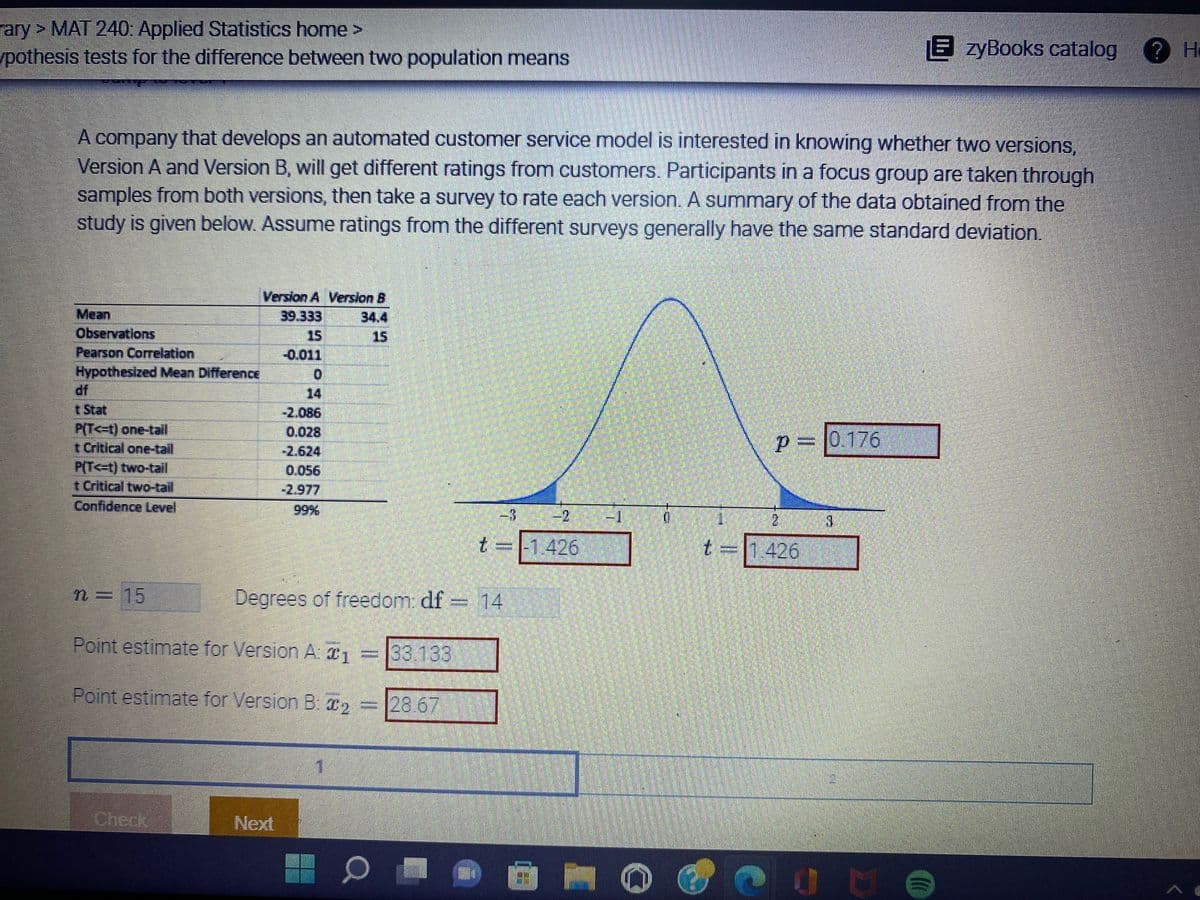
A company that develops an automated customer service model is interested in knowing whether two versions,
Version A and Version B, will get different ratings from customers. Participants in a focus group are taken through
samples from both versions, then take a survey to rate each version. A summary of the data obtained from the
study is given below. Assume ratings from the different surveys generally have the same standard deviation.
Version A Version B
Mean
39.333
34.4
Observations
Pearson Correlation
-0.011
0
Hypothesized Mean Difference
-2.086
P(T<=t) one-tail
0.028
p = 0.176
It Critical one-tail
-2.624
P(T<=t) two-tail
0.056
t Critical two-tail
-2.977
Confidence Level
2
2
13
t = -1.426
1.426
n = 15
Degrees of freedom: df 14
Point estimate for Version A: 1 33.133
Point estimate for Version B: 0₂
28.67
1
Check
Next
7
É HO
JU
zyBooks catalog > H
Expert Solution
This question has been solved!
Explore an expertly crafted, step-by-step solution for a thorough understanding of key concepts.

Step by step
Solved in 2 steps

Recommended textbooks for you

Big Ideas Math A Bridge To Success Algebra 1: Stu…
Algebra
ISBN:
9781680331141
Author:
HOUGHTON MIFFLIN HARCOURT
Publisher:
Houghton Mifflin Harcourt
Big Ideas Math A Bridge To Success Algebra 1: Stu…
Algebra
ISBN:
9781680331141
Author:
HOUGHTON MIFFLIN HARCOURT
Publisher:
Houghton Mifflin Harcourt