A company that sells digital devices has its stores in several cities in Albania. The Marketing Manager plans to transmite an advertisement for the digital camera product on local television and watch sales of that product, to see the link that exists with the number of ads transmitted and product sales. After two days, the results were presented in the following table: City Trasmitted Sales(in 000 Euro) Durrës 4 15 Sarandë 2 8 Fier 5 21 Berat 6 24 Lezhë 3 17 S S = 1.58 S = 6.1 a) What is the dependent variable? b) Construct the scatterdiagram of this connection. c) Calculate the coefficient of variation and the coefficient of determination


Compound Probability
Compound probability can be defined as the probability of the two events which are independent. It can be defined as the multiplication of the probability of two events that are not dependent.
Tree diagram
Probability theory is a branch of mathematics that deals with the subject of probability. Although there are many different concepts of probability, probability theory expresses the definition mathematically through a series of axioms. Usually, these axioms express probability in terms of a probability space, which assigns a measure with values ranging from 0 to 1 to a set of outcomes known as the sample space. An event is a subset of these outcomes that is described.
Conditional Probability
By definition, the term probability is expressed as a part of mathematics where the chance of an event that may either occur or not is evaluated and expressed in numerical terms. The range of the value within which probability can be expressed is between 0 and 1. The higher the chance of an event occurring, the closer is its value to be 1. If the probability of an event is 1, it means that the event will happen under all considered circumstances. Similarly, if the probability is exactly 0, then no matter the situation, the event will never occur.
A company that sells digital devices has its stores in several cities in Albania. The Marketing Manager plans to transmite an advertisement for the digital camera product on local television and watch sales of that product, to see the link that exists with the number of ads transmitted and product sales. After two days, the results were presented in the following table:
|
City |
Trasmitted |
Sales(in 000 Euro) |
|
Durrës |
4 |
15 |
|
Sarandë |
2 |
8 |
|
Fier |
5 |
21 |
|
Berat |
6 |
24 |
|
Lezhë |
3 |
17 |
|
S |
S = 1.58 |
S = 6.1 |
a) What is the dependent variable?
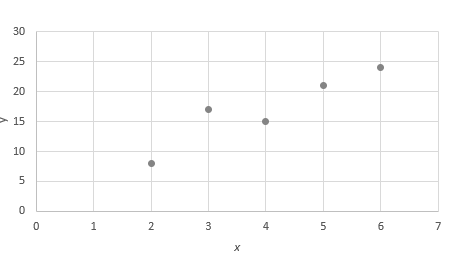
b) Construct the scatterdiagram of this connection.
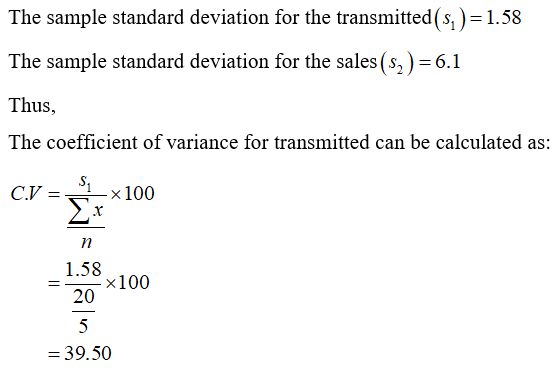
c) Calculate the coefficient of variation and the coefficient of determination.
d) Interpret the relationship between two variables.
e) What is the equation that connects these two variables? Explain the values for a and b.
f) What is the expected level of sales if 10 ads are trasmitted
Since we only answer up to 3 sub-parts, we’ll answer the first 3. Please resubmit the question and specify the other subparts (up to 3) you’d like answered
It given that the Manager wants to transmit an advertisement for the digital camera product on local television and watch sales of that product.
Consider that x and y are defined as the number of ads transmitted and product sales, respectively.
Hence, the number of ads would be the independent variable while product sales would be the dependent variable.
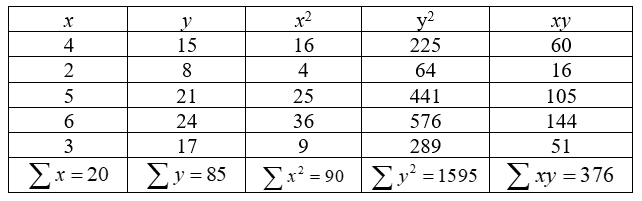
The given data set is:
a).
The dependent variable is product sales.
b).
the scatter diagram for the connection, it could be constructed as:
c).
The sample size (n) is 5.

Step by step
Solved in 5 steps with 5 images


