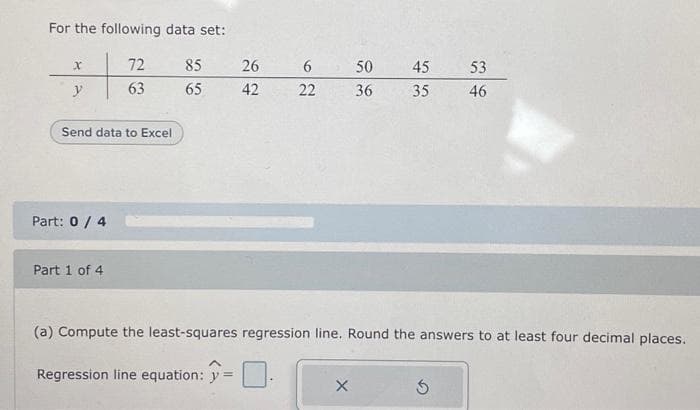
(a) Compute the least-squares regression line. Round the answers to at least four decimal places. Regression line equation: = X 5


Q: Given a random variable X with following distribution: Ja(20-n) if 0 ≤ n ≤ 20 / 0 otherwise P(X = n)…
A: The probability mass function property is :
Q: The forward selection procedure starts with how many independent variable(s) in the multiple…
A: From the above given data the following solution is provided below:
Q: Which score indicates the highest relative position? Round your answer to two decimal places, if…
A: We have to identify , which score indicates the highest relative position .Using formula,
Q: On a summer day, buses with tourists arrive in the picturesque village of Edam according to a…
A: From the above given data the following solution is provided below:
Q: b) Exhibit 2 shows the histogram and Exhibit 3 gives a table of summary statistics for the…
A: Based on the given output, give a conclusion to the above questions.
Q: With any set of scores that is normally distributed, what percentage of the total area falls (hint:…
A: We have to calculate area for the graph which made for normally distributed data. For normal…
Q: SUMMARY OUTPUT Regression Statistics Multiple R R Square Adjusted R Square Standard Error…
A: Regression Model - It is a statistical tool used for modeling the relationship between a dependent…
Q: 3. Let the random variable X have the pmf f(x) = = a) E(X) b) E(X²) c) E(3X²2X + 4) (x+1)² for x =…
A: The provided information is as follows:The probability mass function of is .
Q: Consider the following distribution of scores with a mean of 90 and a standard deviation of 30. For…
A: Mean Standard deviation
Q: FROM ABOVE: I collect data for a location's revenue (in thousands of dollars) and the number of…
A: The collected data for a location's revenue (in thousands of dollars) and the number of salesperson…
Q: c. For a single randomly selected movie, find the probability that this movie's production cost is…
A: Given,Mean, μ = 66 million dollars.Standard deviation, σ = 18 million dollars.Using formula,
Q: The following data represent the time between eruptions and the length of eruption for 8 randomly…
A: a)The regression analysis of independent variable time between eruptions, x and the dependent…
Q: . An urn contains 5 red balls, 9 blue balls and 6 green balls. Use this information for both (a) and…
A: Urn contain 5 red, 9 blue, 6 green
Q: You are a member of a class of 18 students. A bowl contains 18 chips: one blue and 17 red. Each…
A:
Q: Suppose babies born after a gestation period of 32 to 35 weeks have a mean weight of 2700 grams and…
A: Suppose that the random variable x defines the weight of babies.
Q: Low density lipoprotein, or LDL, is the main source of cholesterol buildup and blockage in the…
A: Empirical rule:The probability that the observation under the normal curve lies within 1 standard…
Q: All discrete variables are categorical but not all categorical variables are discrete. True False
A: A variable is a characteristic that is being measured.
Q: Date DJIA S&P 500 Day 1 35405.24 4536.54 Day 2 35629.33 4579.38 Day 3 35111.16 4467.44 Day 4…
A: The data indicates the closing price for the DJIA and the S&P 500 for 144 days in a certain…
Q: Control Limits and Capability of Process Control
A: From the above given data the following solution is provided below:
Q: Step 5 of 5: What is the conclusion?
A: Let be the population variance.Given that,Pop. mean Pop. variance Sample size Sample mean Sample…
Q: The data below are the frequency of cremation burials found in 17 archaeological sites. a. Obtain…
A: Given data 836944495163433281234044371278943058242122We have to finda. mean, median and mode b.…
Q: ing table. X 6 5 int 2532 - 4 3 f 2 1
A: The distribution of scores shown in the following table:Xf6255433221
Q: One of the major measures of the quality of service provided by an organization is the speed with…
A: Since you have posted a question with multiple sub-parts, we will solve first three sub-parts for…
Q: -Cola Walt Disney FedEx Southwest Airlines General Electric American Express Costco Wholesale Nike…
A: The objective of this part is to find the median return for the top ranked 50 companies.Arrange the…
Q: Define the term statistics. Define the term data as it relates to statistics. In the data…
A: Statistics:Statistics is a branch of mathematics that deals with the collection, analysis,…
Q: Engineers observe that about 90% of graphite samples fracture within 5 hours when subjected to a…
A: x=5F(x) =F(5) =0.90
Q: Question 12 of 16 View Policies The interval is i Current Attempt in Progress Use the 95 % rule and…
A: From the above given data the following solution is provided below:
Q: Researchers collected information on the body parts of a new species of frog. The thumb length for…
A: The thumb length for the female frog has Mean = 8.28 mm Standard deviation = 0.78 mm For…
Q: 6 percent nonconforming 12 percent of the time. use acceptance numbers of 1,2 and 4. from a…
A: In the pursuit of devising effective single sampling plans to identify and reject lots containing 6…
Q: Which measure of central tendency is most appropriate when analyzing data that is normally…
A: The mean is best measure of central tendency used when data are normally distributed mean is a…
Q: An outlier is an observation that falls more than 1.5 IQR's above the third quartile or more than…
A: An outlier is an observation that falls more than 1.5 IQR's above the third quartile or more than…
Q: There are currently six global credit card companies that allow worldwide usage-Visa, Mastercard,…
A: Credit cardNumber of worldwide transactionsVisa147.88Mastercard75.81American…
Q: Can you help me correct this? It is the right findings can you out it in APA? What is the mean and…
A: In APA format:"" represents the mean."" represents the standard deviation.In summary, the…
Q: Suppose that X1, X2, ..., Xn are iid N (9a, 302). The MLE for the parameter a is then O Σ1 Xi 3n ΗΣ…
A: Xi ~N(9a,3σ2) ; i=1,2,...,n
Q: A local college newsletter reported that the average American college student spends one hour (60…
A: Let X1 be the daily time spent (in minutes) on the website for 30 males and X2 be the daily time…
Q: Assume that the amounts of weight that male college students gain during their freshman year are…
A: From the given information ,X follows Normaldistribution ,Mean = 1.1Standard Deviation= 4.9And , If…
Q: Use the drawing tools to form the correct answer on the provided number line. Daniel is buying gas…
A: Let's represent the possible spending range for Daniel to fill his gas tank considering a variance…
Q: The number of cars that pass through a certain intersection follows a Poisson distribution with a…
A: The no. of cars that pass through a certain intersection follows a Poisson distribution with a mean…
Q: A sample space consists of five simple events with P(E₁) = P(E₂) = 0.3, P(E3) = 0.1, and P(E4) =…
A: According to the given information in this question we are going to find the following probability
Q: (b) The margin of error for the population proportion estimate, p, is 0.01. Use this information to…
A: Given :Total young people in the US = 7335Proportion of young people arrested for a crime other than…
Q: An evaluation was recently performed on brands and data were collected that classified each brand as…
A: The given hypothesis is versus .
Q: Calculate the coefficient of variation and interpret the value obtained.
A: The coefficient of variation (CV) is a normalized measure of the dispersion of a probability…
Q: The following data gives the numbers of driving citations received by 10 drivers. 7 4 8 3 68 11 4 78…
A: Given 3 different types of data.1) Number of driving citations received by 10 drivers.2) Annual…
Q: Use the following results from a test for marijuana use, which is provided by a certain drug testing…
A: From the given dataNumber of positive test results = 147Number of false positive results =27Total…
Q: Suppose that the weight of seedless watermelons is normally distributed with mean 6.6 kg. and…
A: Given information:X denotes the weight of a randomly selected seedless watermelon.Mean kgStandard…
Q: It is possible to score higher than 1600 on the combined mathematics and reading portions of the…
A: Let X be the SAT score in 2019.Given that the distribution of X approximately normal with µ=1003 and…
Q: Question 6: Mercury pollution: Mercury is a toxic metal that is used in many industrial…
A: We have given that Data : 0.99, 1.01, 1.02, 0.94, 0.93, 1, 0.96, 0.98Sample size (n)=88Sample mean…
Q: d. For the 14 tires tested, find the probability that the average miles (in thousands) before need…
A: Mean=66, Standard deviation=16
Q: A company produces steel rods. The lengths of the steel rods are normally distributed with a mean of…
A: X~N(μ=124.1,σ=1.6)n=7
Q: A year later, Barbara gives you a call and tells you that the actual sales for the four quarters of…
A: Given data available in the following tablePeriodForecast valueactual value2017…


Trending now
This is a popular solution!

Step by step
Solved in 4 steps with 1 images

- The following fictitious table shows kryptonite price, in dollar per gram, t years after 2006. t= Years since 2006 0 1 2 3 4 5 6 7 8 9 10 K= Price 56 51 50 55 58 52 45 43 44 48 51 Make a quartic model of these data. Round the regression parameters to two decimal places.Which of the following does not need to be computed to determine a simple regression line? SSx SP "Y-hat" SSyCompute the least-squares regression equation for the given data set. Use a TI-84 calculator. Round the slope and y intercept to at least four decimal places. x 5 7 6 2 1 y 4 3 2 5 1 Regression line equation: =
- Compute the least-squares regression equation for the given data set. Round the slope and y-intercept to at least four decimal places. 2 4 7 6 6 5 3 3 4 2Use the following data for parts (a) through (e). x 5 7 3 16 12 9 y 8 9 11 27 15 13 Determine the equation of the least squares regression line to predict y by x. y^ = (value rounded to 4 decimal places ?) + (value rounded to 4 decimal places ?) xCompute the least-squares regression equation for the given data set. Use a TI-84 calculator. Round the slope and y-Intercept to at least four decimal places.
- Compute the least-squares regression line for predicting y from x given the following summary statistics. Round the slope and y -intercept to at least four decimal places. =x8.2 =sx3 =y1350 =sy13,000 =r0.40A company trains its employees with instructional videos and claims that the amount of time, in hours, spent training is linearly related to an increase in productivity. The company selected a random sample of five employees to test its claim. The data were used to create the computer output for a least-squares linear regression, shown in the table. Variable DF Estimate SE Intercept 1 3.6 1.1489 Hours 1 0.8 0.3464 Which of the following is the correct test statistic and number of degrees of freedom? t=2.31 with 4 degrees of freedom A t=2.31 with 3 degrees of freedom B t=2.31 with 5 degrees of freedom C t=3.13 with 1 degree of freedom D t=3.13 with 3 degrees of freedom EThe following model was fitted to a sample of 30 families in order to explain household milk consumption:y = b0 + b1x1 + b2x2 + ε wherey = milk consumption, in quarts per weekx1 = weekly income, in hundreds of dollarsx2 = family sizeThe least squares estimates of the regression parameters were as follows:b0 = -0.025 b1 = 0.052 b2 = 1.14Predict the weekly milk consumption of a family of four with an income of $600 per week.
- Which of the multivariate regression parameters listed below would be best interpreted as: the predicted value on the dependent variable when all of the independent variables in the model are equal to zero. a b1 X1 R2For a sample of 15 trees, the volume of lumber (y) (in cubic meters) and the diameter (x) (in centimeters) at a fixed height above ground level was measured. The following summary statistics were obtained: x̄ = 35.2 sx = 8.9 ȳ = 0.78 sy = 0.48 r = 0.95 a) Compute the least-squares regression line for predicting volume from diameter. B)Predict the volume for a tree whose diameter is 42 centimetersA seafood-sales manager collected data on the maximum daily temperature, T, and the daily revenue from salmon sales, R, using sales receipts for 30 days selected at random. Using the data, the manager conducted a regression analysis and found the least-squares regression line to be Rˆ=126+2.37T. A hypothesis test was conducted to investigate whether there is a linear relationship between maximum daily temperature and the daily revenue from salmon sales. The standard error for the slope of the regression line is SEb1=0.65. Assuming the conditions for inference have been met, which of the following is closest to the value of the test statistic for the hypothesis test? t=0.274 A t=0.65 B t=1.54 C t=3.65 D t=193.85 E