Find the value of k.

Algebra & Trigonometry with Analytic Geometry
13th Edition
ISBN:9781133382119
Author:Swokowski
Publisher:Swokowski
Chapter10: Sequences, Series, And Probability
Section10.8: Probability
Problem 36E

Related questions
Question
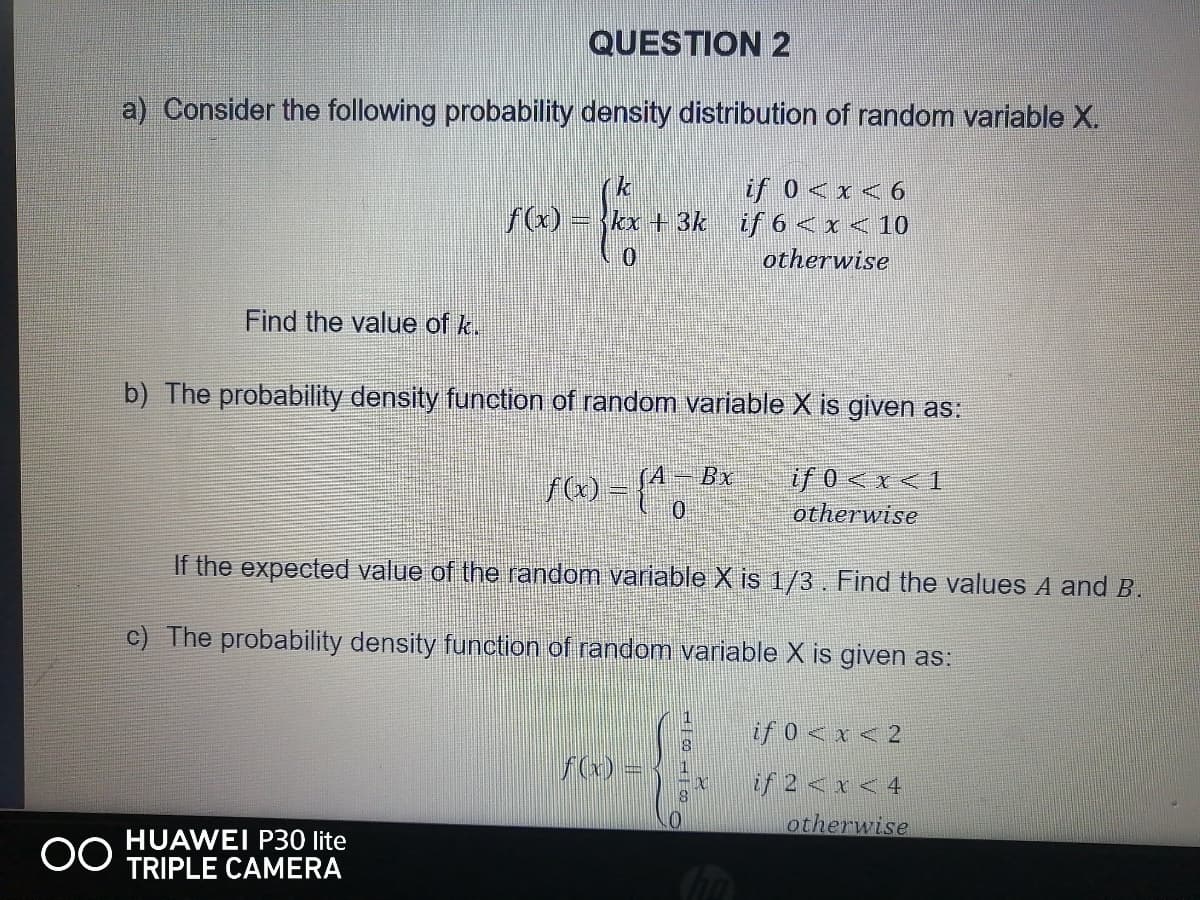
Transcribed Image Text:QUESTION 2
a) Consider the following probability density distribution of random variable X.
if 0 <x < 6
if 6 < x < 10
otherwise
f(x)
ex +3k
Find the value of k.
b) The probability density function of random variable X is given as:
A Bx
f) =
{",
if 0<x <1
otherwise
If the expected value of the random variable X is 1/3. Find the values A and B.
c) The probability density function of random variable X is given as:
1
if 0 < x < 2
f(x) =
if 2 <x < 4
otherwise
HUAWEI P30 lite
TRIPLE CAMERA
Expert Solution
This question has been solved!
Explore an expertly crafted, step-by-step solution for a thorough understanding of key concepts.

Step by step
Solved in 2 steps

Recommended textbooks for you
Algebra & Trigonometry with Analytic Geometry
Algebra
ISBN:
9781133382119
Author:
Swokowski
Publisher:
Cengage
Algebra & Trigonometry with Analytic Geometry
Algebra
ISBN:
9781133382119
Author:
Swokowski
Publisher:
Cengage