(a) Construct a grouped frequency distribution for the data. Use 85-89 for the first class and use the same width for each subsequent class.
(a) Construct a grouped frequency distribution for the data. Use 85-89 for the first class and use the same width for each subsequent class.

Glencoe Algebra 1, Student Edition, 9780079039897, 0079039898, 2018
18th Edition
ISBN:9780079039897
Author:Carter
Publisher:Carter
Chapter10: Statistics
Section10.5: Comparing Sets Of Data
Problem 8PPS

Related questions
Question
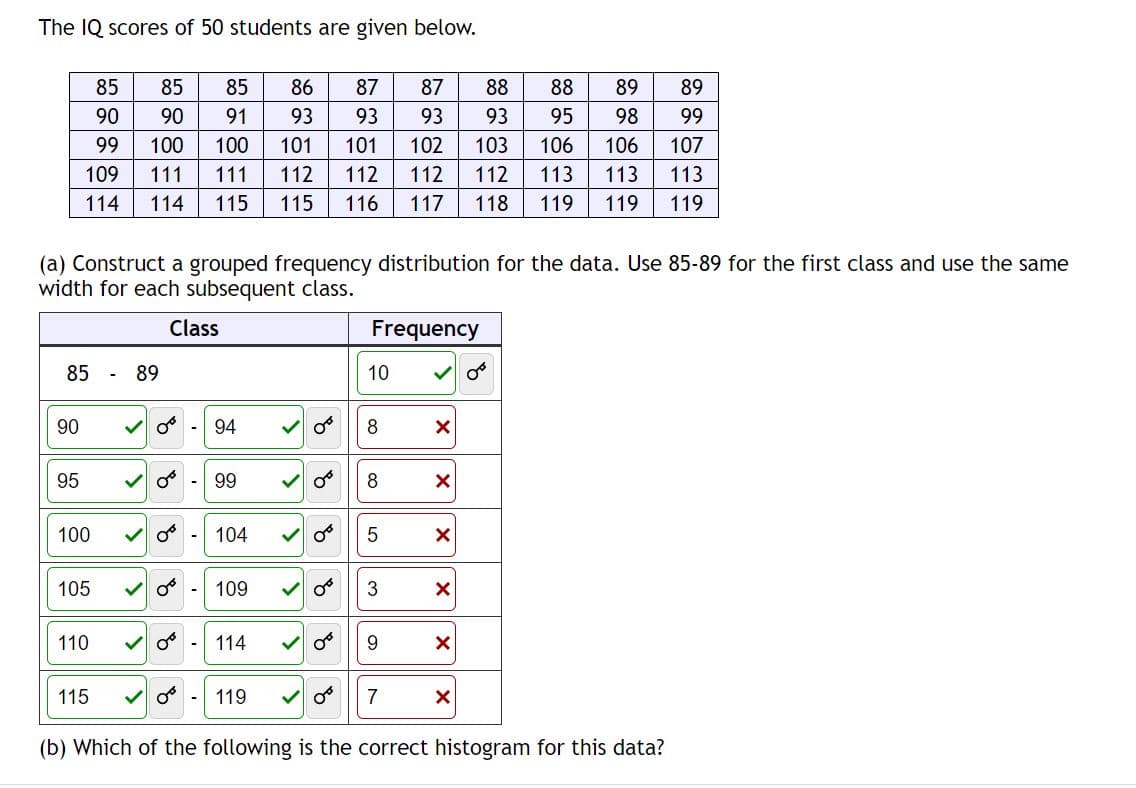
Transcribed Image Text:The IQ scores of 50 students are given below.
85
85
85
86 87 87
88 89 89
90
90
91
93
93
95
98
99
99
100 100 101 101 102 103 106
106
107
109 111 111 112
112 112 112
113
113
113
114 114 115 115 116 117 118 119 119 119
85 - 89
90
95
(a) Construct a grouped frequency distribution for the data. Use 85-89 for the first class and use the same
width for each subsequent class.
Class
100
105
110
115
<
08
94
99
104
109
114
119
>
8
OB
४
8
OF
890
8
OT
93
Frequency
10
8
8
5
3
9
7
X
X
X
X
X
88
93
X
Or
(b) Which of the following is the correct histogram for this data?
Expert Solution
This question has been solved!
Explore an expertly crafted, step-by-step solution for a thorough understanding of key concepts.

Step by step
Solved in 3 steps with 1 images

Recommended textbooks for you
Glencoe Algebra 1, Student Edition, 9780079039897…
Algebra
ISBN:
9780079039897
Author:
Carter
Publisher:
McGraw Hill
Glencoe Algebra 1, Student Edition, 9780079039897…
Algebra
ISBN:
9780079039897
Author:
Carter
Publisher:
McGraw Hill