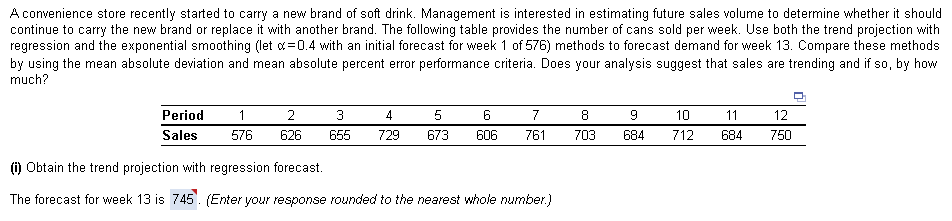
A convenience store recently started to carry a new brand of soft drink. Management is interested in estimating future sales volume to determine whether it should continue to carry the new brand or replace it with another brand. The following table provides the number of cans sold per week. Use both the trend projection with regression and the exponential smoothing (let c=0.4 with an initial forecast for week 1 of 576) methods to forecast demand for week 13. Compare these methods by using the mean absolute deviation and mean absolute percent error performance criteria. Does your analysis suggest that sales are trending and if so, by how much? Period 8 761 703 11 12 750 1 2 4 5 6 7 10 Sales 576 626 655 729 673 606 684 712 684 ) Obtain the trend projection with regression forecast. The forecast for week 13 is 745. (Enter your response rounded to the nearest whole number.)
A convenience store recently started to carry a new brand of soft drink. Management is interested in estimating future sales volume to determine whether it should continue to carry the new brand or replace it with another brand. The following table provides the number of cans sold per week. Use both the trend projection with regression and the exponential smoothing (let c=0.4 with an initial forecast for week 1 of 576) methods to forecast demand for week 13. Compare these methods by using the mean absolute deviation and mean absolute percent error performance criteria. Does your analysis suggest that sales are trending and if so, by how much? Period 8 761 703 11 12 750 1 2 4 5 6 7 10 Sales 576 626 655 729 673 606 684 712 684 ) Obtain the trend projection with regression forecast. The forecast for week 13 is 745. (Enter your response rounded to the nearest whole number.)

Practical Management Science
6th Edition
ISBN:9781337406659
Author:WINSTON, Wayne L.
Publisher:WINSTON, Wayne L.
Chapter13: Regression And Forecasting Models
Section13.7: Exponential Smoothing Models
Problem 26P: The file P13_26.xlsx contains the monthly number of airline tickets sold by the CareFree Travel...

Related questions
Question
please answer in 30 mins.
Transcribed Image Text:A convenience store recently started to carry a new brand of soft drink. Management is interested in estimating future sales volume to determine whether it should
continue to carry the new brand or replace it with another brand. The following table provides the number of cans sold per week. Use both the trend projection with
regression and the exponential smoothing (let d=0.4 with an initial forecast for week 1 of 576) methods to forecast demand for week 13. Compare these methods
by using the mean absolute deviation and mean absolute percent error performance criteria. Does your analysis suggest that sales are trending and if so, by how
much?
Period
2
3
4
5
7
8
10
11
12
Sales
576
626
655
729
673
606
761
703
684
712
684
750
(i) Obtain the trend projection with regression forecast.
The forecast for week 13 is 745'. (Enter your response rounded to the nearest whole number.)
Expert Solution
This question has been solved!
Explore an expertly crafted, step-by-step solution for a thorough understanding of key concepts.

This is a popular solution!

Trending now
This is a popular solution!

Step by step
Solved in 4 steps with 8 images

Recommended textbooks for you
Practical Management Science
Operations Management
ISBN:
9781337406659
Author:
WINSTON, Wayne L.
Publisher:
Cengage,

Purchasing and Supply Chain Management
Operations Management
ISBN:
9781285869681
Author:
Robert M. Monczka, Robert B. Handfield, Larry C. Giunipero, James L. Patterson
Publisher:
Cengage Learning

Practical Management Science
Operations Management
ISBN:
9781337406659
Author:
WINSTON, Wayne L.
Publisher:
Cengage,
Purchasing and Supply Chain Management
Operations Management
ISBN:
9781285869681
Author:
Robert M. Monczka, Robert B. Handfield, Larry C. Giunipero, James L. Patterson
Publisher:
Cengage Learning

Contemporary Marketing
Marketing
ISBN:
9780357033777
Author:
Louis E. Boone, David L. Kurtz
Publisher:
Cengage Learning
Marketing
Marketing
ISBN:
9780357033791
Author:
Pride, William M
Publisher:
South Western Educational Publishing