A corporation owns several companies. The strategic planner for the corporations believes dollars spend on advertising can to some extend be a predictor of total sales dollars. As an aid in long-term planning, she gathers the following sales and advertising information from several of the companies for 2017 (S millions). Advertising Sales 12.5 148 3.7 55 21.6 338 60.0 994 37.6 541 6.1 89 16.8 126 41.2 379 i) Based on the output given, develop the equation of the simple linear regression line to predict sales from advertising expenditures using this data. ii) Explain the values of r and r. iii) Predict the sales if the advertising expenditures is 50 ($ millions). iv) Do the data support the existence of a linear relationship between advertising expenditures and sales? Test using a = 0.05.
A corporation owns several companies. The strategic planner for the corporations believes dollars spend on advertising can to some extend be a predictor of total sales dollars. As an aid in long-term planning, she gathers the following sales and advertising information from several of the companies for 2017 (S millions). Advertising Sales 12.5 148 3.7 55 21.6 338 60.0 994 37.6 541 6.1 89 16.8 126 41.2 379 i) Based on the output given, develop the equation of the simple linear regression line to predict sales from advertising expenditures using this data. ii) Explain the values of r and r. iii) Predict the sales if the advertising expenditures is 50 ($ millions). iv) Do the data support the existence of a linear relationship between advertising expenditures and sales? Test using a = 0.05.

A First Course in Probability (10th Edition)
10th Edition
ISBN:9780134753119
Author:Sheldon Ross
Publisher:Sheldon Ross
Chapter1: Combinatorial Analysis
Section: Chapter Questions
Problem 1.1P: a. How many different 7-place license plates are possible if the first 2 places are for letters and...

Related questions

Topic Video
Question
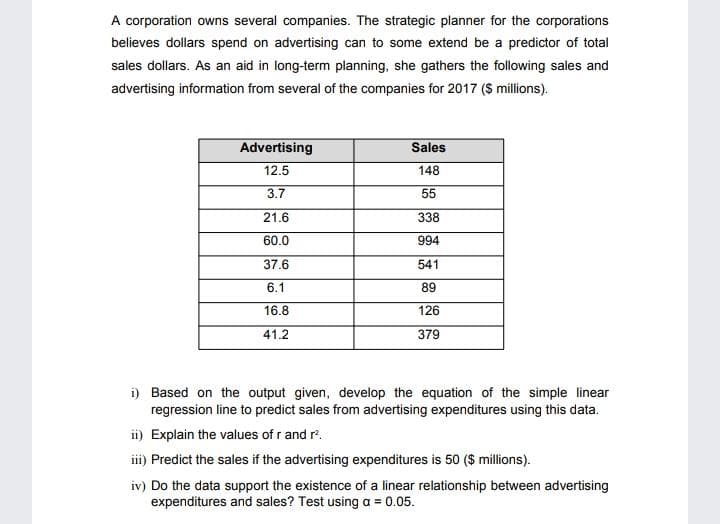
Transcribed Image Text:A corporation owns several companies. The strategic planner for the corporations
believes dollars spend on advertising can to some extend be a predictor of total
sales dollars. As an aid in long-term planning, she gathers the following sales and
advertising information from several of the companies for 2017 ($ millions).
Advertising
Sales
12.5
148
3.7
55
21.6
338
60.0
994
37.6
541
6.1
89
16.8
126
41.2
379
i) Based on the output given, develop the equation of the simple linear
regression line to predict sales from advertising expenditures using this data.
ii) Explain the values of r and r.
iii) Predict the sales if the advertising expenditures is 50 ($ millions).
iv) Do the data support the existence of a linear relationship between advertising
expenditures and sales? Test using a = 0.05.
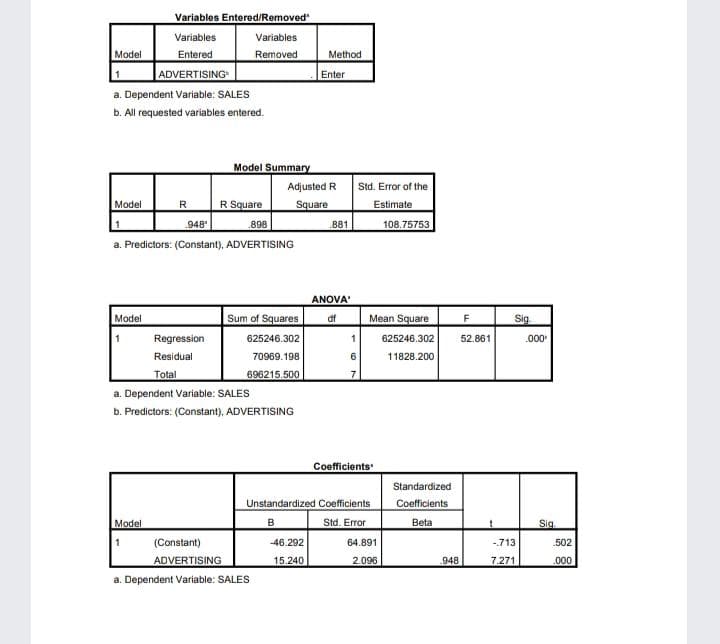
Transcribed Image Text:Variables Entered/Removed
Variables
Variables
Model
Entered
Removed
Method
ADVERTISING
Enter
a. Dependent Variable: SALES
b. All requested variables entered.
Model Summary
Adjusted R
Std. Error of the
Model
R Square
Square
R
Estimate
948
.898
881
108.75753
a. Predictors: (Constant), ADVERTISING
ANOVA'
Model
Sum of Squares
Mean Square
Sig
df
F
1
Regression
625246.302
625246.302
52.861
.00
Residual
70969.198
6
11828.200
Total
696215.500
7
a. Dependent Variable: SALES
b. Predictors: (Constant), ADVERTISING
Coefficients
Standardized
Unstandardized Coefficients
Coefficients
Std. Error
Model
Beta
Sig
1
(Constant)
-46.292
64.891
-.713
502
ADVERTISING
15.240
2.096
948
7.271
000
a. Dependent Variable: SALES
Expert Solution
This question has been solved!
Explore an expertly crafted, step-by-step solution for a thorough understanding of key concepts.

This is a popular solution!

Trending now
This is a popular solution!

Step by step
Solved in 4 steps

Knowledge Booster


Learn more about
Need a deep-dive on the concept behind this application? Look no further. Learn more about this topic, probability and related others by exploring similar questions and additional content below.Recommended textbooks for you
A First Course in Probability (10th Edition)
Probability
ISBN:
9780134753119
Author:
Sheldon Ross
Publisher:
PEARSON

A First Course in Probability (10th Edition)
Probability
ISBN:
9780134753119
Author:
Sheldon Ross
Publisher:
PEARSON