The manager of specialty outdoor store has gathered the following data concerning sales (in hundreds of dollars) of all the itens sold by the store in the previous 2 months: Number Item Type Sales $ (00s) Sold Pants, jackets, and insulating layers Hats and gloves Socks and shoes 150 125 30 15 75 400 Skiing hardware Climbing hardware 25 65 70 45
The manager of specialty outdoor store has gathered the following data concerning sales (in hundreds of dollars) of all the itens sold by the store in the previous 2 months: Number Item Type Sales $ (00s) Sold Pants, jackets, and insulating layers Hats and gloves Socks and shoes 150 125 30 15 75 400 Skiing hardware Climbing hardware 25 65 70 45

Algebra & Trigonometry with Analytic Geometry
13th Edition
ISBN:9781133382119
Author:Swokowski
Publisher:Swokowski
Chapter8: Applications Of Trigonometry
Section8.2: The Law Of Cosines
Problem 41E

Related questions

Concept explainers
Equations and Inequations
Equations and inequalities describe the relationship between two mathematical expressions.
Linear Functions
A linear function can just be a constant, or it can be the constant multiplied with the variable like x or y. If the variables are of the form, x2, x1/2 or y2 it is not linear. The exponent over the variables should always be 1.
Question
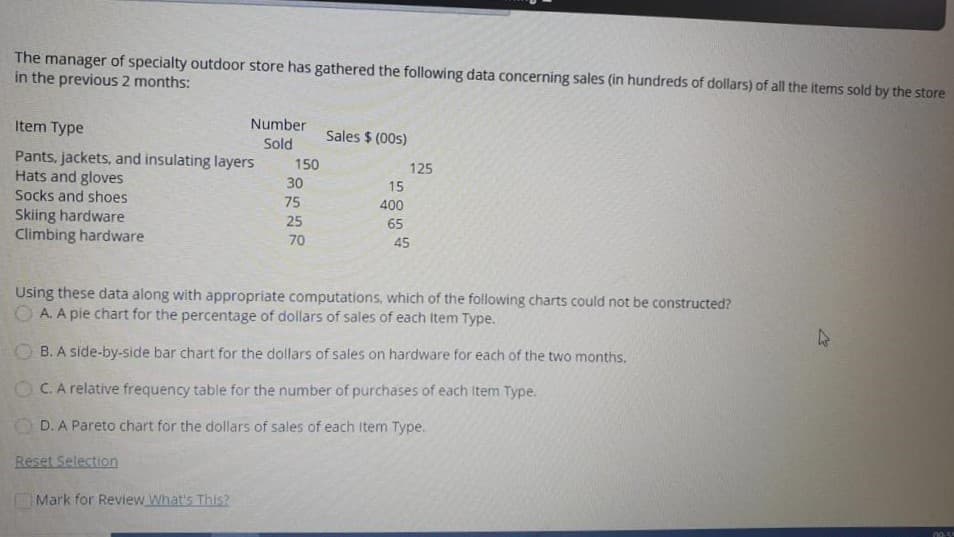
Transcribed Image Text:The manager of specialty outdoor store has gathered the following data concerning sales (in hundreds of dollars) of all the items sold by the store
in the previous 2 months:
Item Type
Number
Sold
Sales $ (00s)
Pants, jackets, and insulating layers
Hats and gloves
Socks and shoes
Skiing hardware
Climbing hardware
150
125
30
15
75
400
25
65
70
45
Using these data along with appropriate computations, which of the following charts could not be constructed?
O A. A pie chart for the percentage of dollars of sales of each Item Type.
O B. A side-by-side bar chart for the dollars of sales on hardware for each of the two months.
O C. A relative frequency table for the number of purchases of each Item Type.
O D. A Pareto chart for the dollars of sales of each Item Type.
Reset Selection
Mark for Review What's This?
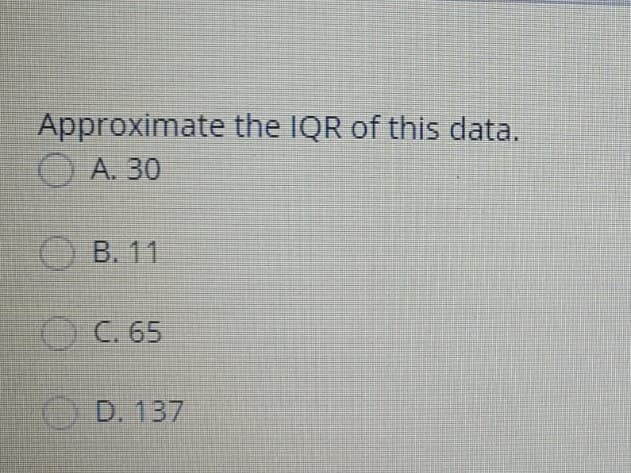
Transcribed Image Text:Approximate the IQR of this data.
O A. 30
OB. 11
OC. 65
O D. 137
Expert Solution
This question has been solved!
Explore an expertly crafted, step-by-step solution for a thorough understanding of key concepts.

This is a popular solution!

Trending now
This is a popular solution!

Step by step
Solved in 2 steps

Knowledge Booster


Learn more about
Need a deep-dive on the concept behind this application? Look no further. Learn more about this topic, statistics and related others by exploring similar questions and additional content below.Recommended textbooks for you
Algebra & Trigonometry with Analytic Geometry
Algebra
ISBN:
9781133382119
Author:
Swokowski
Publisher:
Cengage

Algebra: Structure And Method, Book 1
Algebra
ISBN:
9780395977224
Author:
Richard G. Brown, Mary P. Dolciani, Robert H. Sorgenfrey, William L. Cole
Publisher:
McDougal Littell

Glencoe Algebra 1, Student Edition, 9780079039897…
Algebra
ISBN:
9780079039897
Author:
Carter
Publisher:
McGraw Hill
Algebra & Trigonometry with Analytic Geometry
Algebra
ISBN:
9781133382119
Author:
Swokowski
Publisher:
Cengage
Algebra: Structure And Method, Book 1
Algebra
ISBN:
9780395977224
Author:
Richard G. Brown, Mary P. Dolciani, Robert H. Sorgenfrey, William L. Cole
Publisher:
McDougal Littell
Glencoe Algebra 1, Student Edition, 9780079039897…
Algebra
ISBN:
9780079039897
Author:
Carter
Publisher:
McGraw Hill