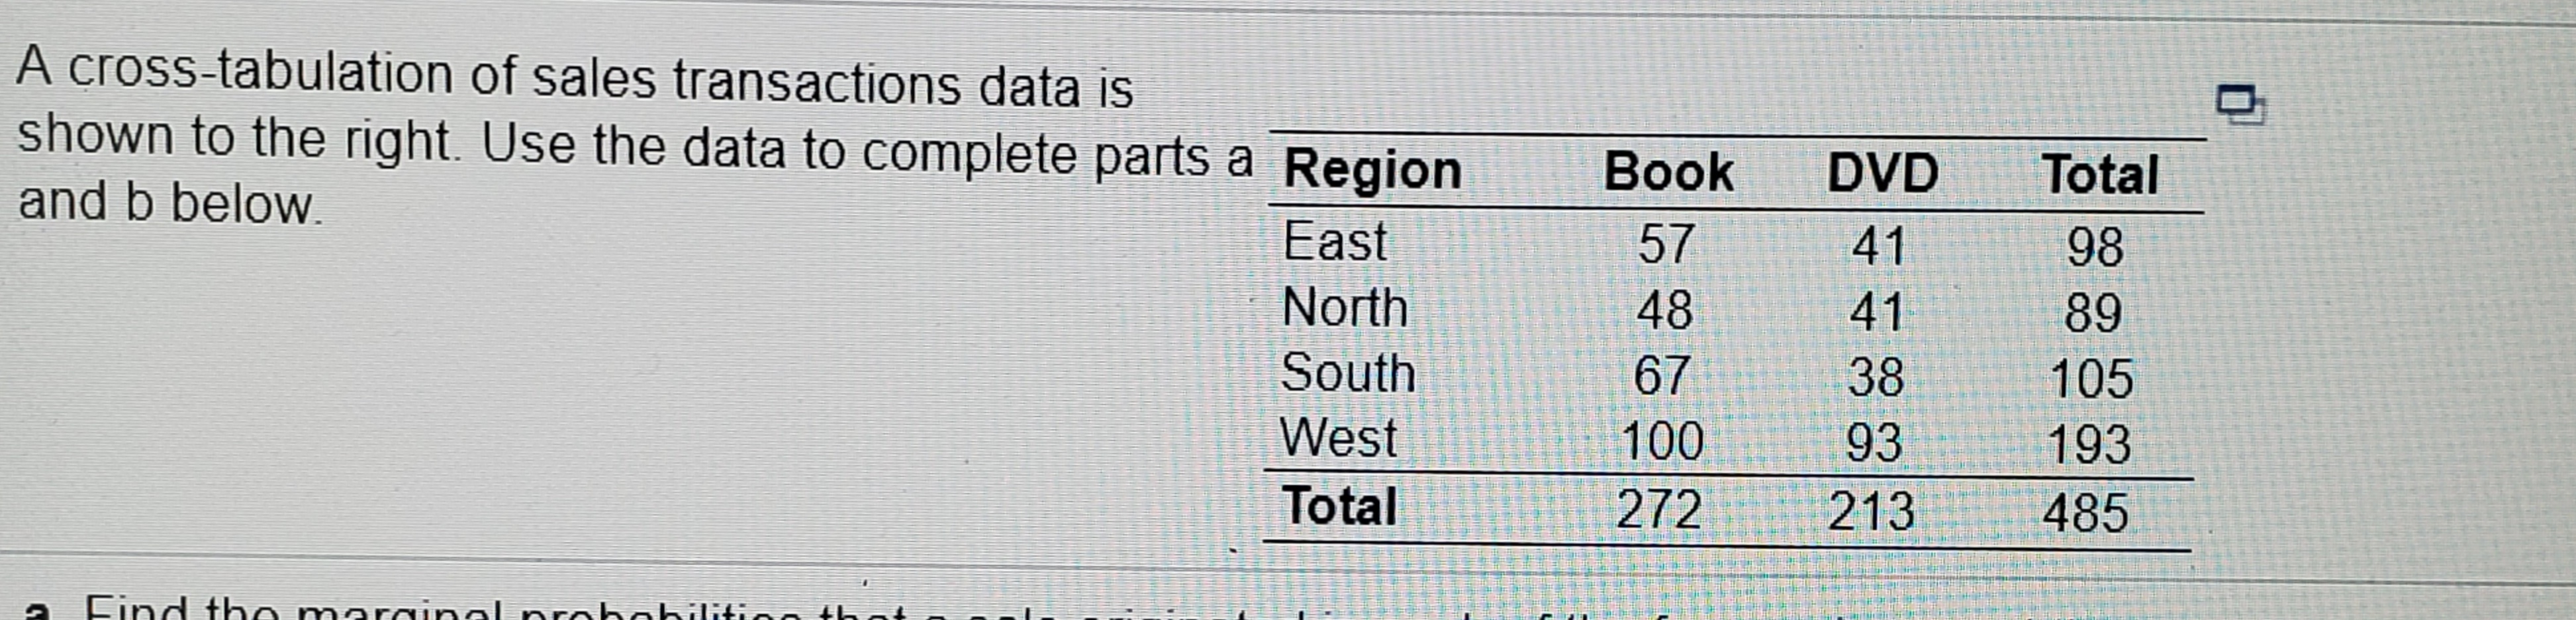
A cross-tabulation of sales transactions data is shown to the right. Use the data to complete parts a Region Вok DVD Total and b below. East 57 41 98 North 48 41 89 South 67 38 105 West 100 93 193 Total 272 213 485
A cross-tabulation of sales transactions data is shown to the right. Use the data to complete parts a Region Вok DVD Total and b below. East 57 41 98 North 48 41 89 South 67 38 105 West 100 93 193 Total 272 213 485

Holt Mcdougal Larson Pre-algebra: Student Edition 2012
1st Edition
ISBN:9780547587776
Author:HOLT MCDOUGAL
Publisher:HOLT MCDOUGAL
Chapter11: Data Analysis And Probability
Section11.1: Stem-and-leaf Plots And Histograms
Problem 6E

Related questions
Topic Video
Question
Transcribed Image Text:A cross-tabulation of sales transactions data is
shown to the right. Use the data to complete parts a Region
Вok
DVD
Total
and b below.
East
57
41
98
North
48
41
89
South
67
38
105
West
100
93
193
Total
272
213
485

Expert Solution
This question has been solved!
Explore an expertly crafted, step-by-step solution for a thorough understanding of key concepts.

This is a popular solution!

Trending now
This is a popular solution!

Step by step
Solved in 5 steps with 5 images

Knowledge Booster


Learn more about
Need a deep-dive on the concept behind this application? Look no further. Learn more about this topic, statistics and related others by exploring similar questions and additional content below.Recommended textbooks for you
Holt Mcdougal Larson Pre-algebra: Student Edition…
Algebra
ISBN:
9780547587776
Author:
HOLT MCDOUGAL
Publisher:
HOLT MCDOUGAL
Holt Mcdougal Larson Pre-algebra: Student Edition…
Algebra
ISBN:
9780547587776
Author:
HOLT MCDOUGAL
Publisher:
HOLT MCDOUGAL