The data below are a survey process which is accomplished in a company : 32 113 70 60 84 114 31 58 86 102 113 79 86 24 40 44 42 54 71 25
The data below are a survey process which is accomplished in a company : 32 113 70 60 84 114 31 58 86 102 113 79 86 24 40 44 42 54 71 25

Holt Mcdougal Larson Pre-algebra: Student Edition 2012
1st Edition
ISBN:9780547587776
Author:HOLT MCDOUGAL
Publisher:HOLT MCDOUGAL
Chapter11: Data Analysis And Probability
Section11.5: Interpreting Data
Problem 1C

Related questions
Question
i need the answer quickly
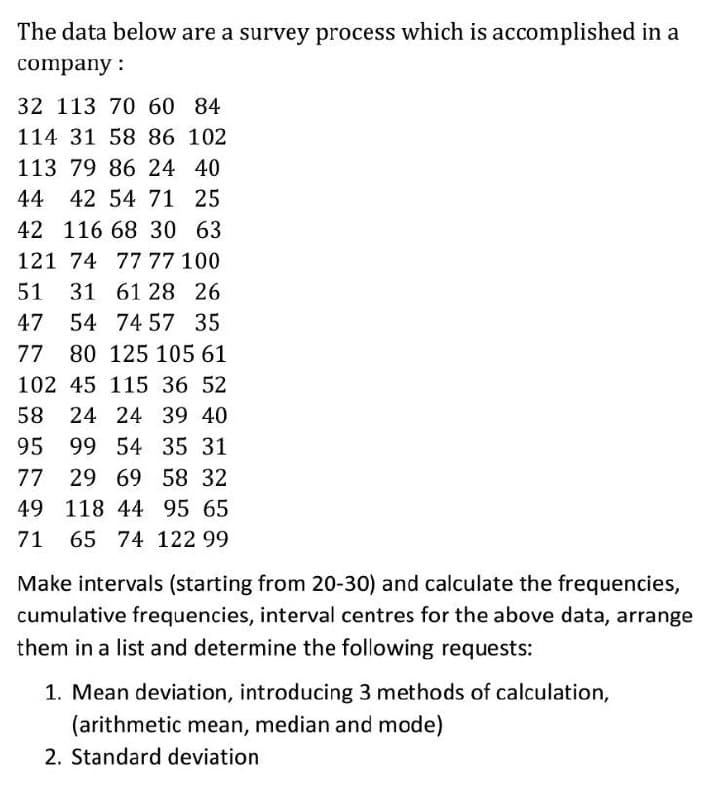
Transcribed Image Text:The data below are a survey process which is accomplished in a
company :
32 113 70 60 84
114 31 58 86 102
113 79 86 24 40
44 42 54 71 25
42 116 68 30 63
121 74 77 77 100
51
31 61 28 26
47 54 74 57 35
77 80 125 105 61
102 45 115 36 52
58 24 24 39 40
95 99 54 35 31
77
29 69 58 32
49 118 44 95 65
71
65 74 122 99
Make intervals (starting from 20-30) and calculate the frequencies,
cumulative frequencies, interval centres for the above data, arrange
them in a list and determine the following requests:
1. Mean deviation, introducing 3 methods of calculation,
(arithmetic mean, median and mode)
2. Standard deviation
Expert Solution
This question has been solved!
Explore an expertly crafted, step-by-step solution for a thorough understanding of key concepts.

Step by step
Solved in 2 steps with 1 images

Recommended textbooks for you
Holt Mcdougal Larson Pre-algebra: Student Edition…
Algebra
ISBN:
9780547587776
Author:
HOLT MCDOUGAL
Publisher:
HOLT MCDOUGAL
Holt Mcdougal Larson Pre-algebra: Student Edition…
Algebra
ISBN:
9780547587776
Author:
HOLT MCDOUGAL
Publisher:
HOLT MCDOUGAL