A decision-maker wishes to test the null and alternative hypotheses shown to the right using an alpha level equal to 0.10. The population standard deviations are assumed to be known. After the sample data are collected, the test statistic is computed to be z= 1.53. Complete parts a through c below. HA H-2#0 b. Using the p-value approach, what decision should be reached about the null hypothesis? Determine the p-value. p-value = (Round to four decimal places as needed.) State the conclusion. Choose the correct answer below. O A. Reject the null hypothesis. There is not sufficient evidence at a=0.10 to suggest that the difference of the population means is different from 0. different from 0. O B. Do not reject the null hypothesis. There is not sufficient evidence at a= 0.10 to suggest that the difference of the population means OC. Do not reject the null hypothesis. There is sufficient evidence at a=0.10 to suggest that the difference of the population means is different from 0. O D. Reject the null hypothesis. There is sufficient evidence at a=0.10 to suggest that the difference of the population means is different from 0 c Will the two approaches (test statistic and p-value) ever provide different conclusions based on the same sample data? Explain. O A. Yes, because it is possible for a test statistic not in the rejection region determined by the critical value(s) to have a p-value less than a O B. Yes, because it is possible for a test statistic in the rejection region determined by the critical value(s) to have a p-value greater than or equal to a
A decision-maker wishes to test the null and alternative hypotheses shown to the right using an alpha level equal to 0.10. The population standard deviations are assumed to be known. After the sample data are collected, the test statistic is computed to be z= 1.53. Complete parts a through c below. HA H-2#0 b. Using the p-value approach, what decision should be reached about the null hypothesis? Determine the p-value. p-value = (Round to four decimal places as needed.) State the conclusion. Choose the correct answer below. O A. Reject the null hypothesis. There is not sufficient evidence at a=0.10 to suggest that the difference of the population means is different from 0. different from 0. O B. Do not reject the null hypothesis. There is not sufficient evidence at a= 0.10 to suggest that the difference of the population means OC. Do not reject the null hypothesis. There is sufficient evidence at a=0.10 to suggest that the difference of the population means is different from 0. O D. Reject the null hypothesis. There is sufficient evidence at a=0.10 to suggest that the difference of the population means is different from 0 c Will the two approaches (test statistic and p-value) ever provide different conclusions based on the same sample data? Explain. O A. Yes, because it is possible for a test statistic not in the rejection region determined by the critical value(s) to have a p-value less than a O B. Yes, because it is possible for a test statistic in the rejection region determined by the critical value(s) to have a p-value greater than or equal to a

Glencoe Algebra 1, Student Edition, 9780079039897, 0079039898, 2018
18th Edition
ISBN:9780079039897
Author:Carter
Publisher:Carter
Chapter10: Statistics
Section10.3: Measures Of Spread
Problem 26PFA

Related questions
Topic Video
Question
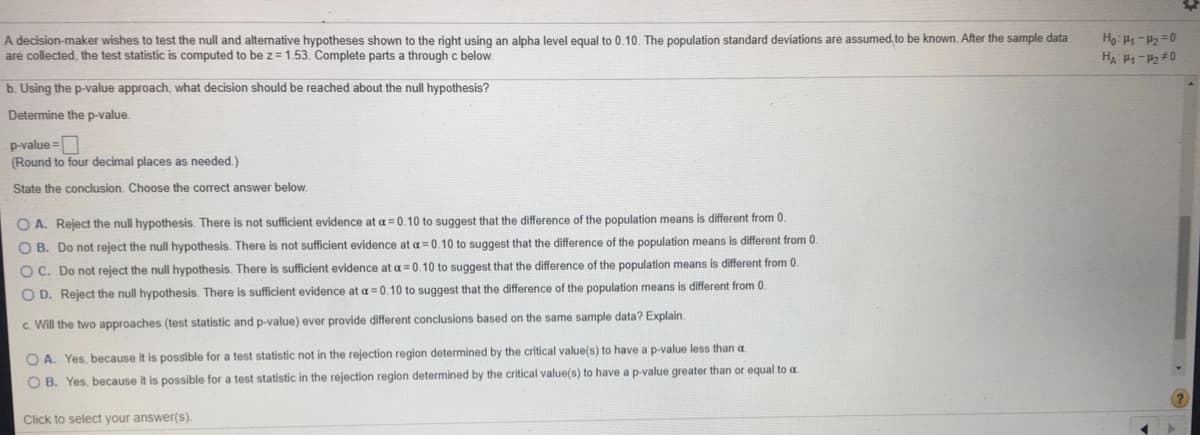
Transcribed Image Text:A decision-maker wishes to test the null and alternative hypotheses shown to the right using an alpha level equal to 0.10. The population standard deviations are assumed, to be known. After the sample data
are collected, the test statistic is computed to be z= 1.53. Complete parts a through c below.
Hg: H -P2 =0
HA H1-2 #0
b. Using the p-value approach, what decision should be reached about the null hypothesis?
Determine the p-value.
p-value =
(Round to four decimal places as needed.)
State the conclusion. Choose the correct answer below.
O A. Reject the null hypothesis. There is not sufficient evidence at a =0.10 to suggest that the difference of the population means is different from 0.
O B. Do not reject the null hypothesis. There is not sufficient evidence at a=0.10 to suggest that the difference of the population means is different from 0
O C. Do not reject the null hypothesis. There is sufficient evidence at a= 0.10 to suggest that the difference of the population means is different from 0.
O D. Reject the null hypothesis. There is sufficient evidence at a =0.10 to suggest that the difference of the population means is different from 0.
c. Will the two approaches (test statistic and p-value) ever provide different conclusions based on the same sample data? Explain.
O A. Yes, because it is possible for a test statistic not in the rejection region determined by the critical value(s) to have a p-value less than a
have a p-value greater than or equal to a.
O B. Yes, because it is possible for a test statistic in the rejection region determined by the critical value(s)
Click to select your answer(s).
Expert Solution
This question has been solved!
Explore an expertly crafted, step-by-step solution for a thorough understanding of key concepts.

This is a popular solution!

Trending now
This is a popular solution!

Step by step
Solved in 2 steps with 1 images

Knowledge Booster


Learn more about
Need a deep-dive on the concept behind this application? Look no further. Learn more about this topic, statistics and related others by exploring similar questions and additional content below.Recommended textbooks for you
Glencoe Algebra 1, Student Edition, 9780079039897…
Algebra
ISBN:
9780079039897
Author:
Carter
Publisher:
McGraw Hill
Glencoe Algebra 1, Student Edition, 9780079039897…
Algebra
ISBN:
9780079039897
Author:
Carter
Publisher:
McGraw Hill