(a) Determine a point estimate for the population mean. A point estimate for the population mean is
(a) Determine a point estimate for the population mean. A point estimate for the population mean is

Glencoe Algebra 1, Student Edition, 9780079039897, 0079039898, 2018
18th Edition
ISBN:9780079039897
Author:Carter
Publisher:Carter
Chapter10: Statistics
Section10.4: Distributions Of Data
Problem 19PFA

Related questions
Topic Video
Question
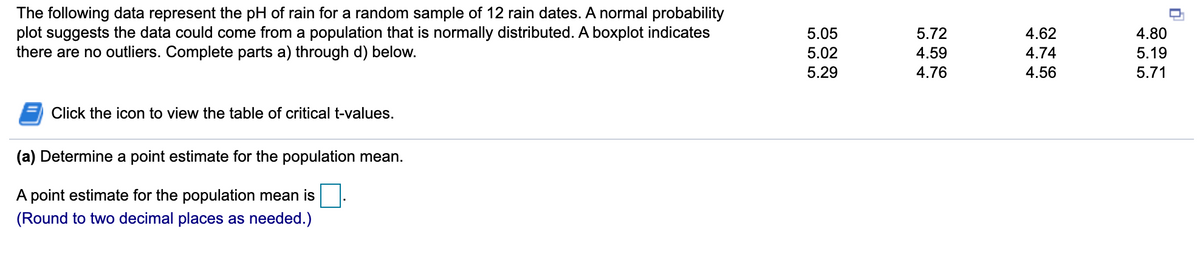
Transcribed Image Text:The following data represent the pH of rain for a random sample of 12 rain dates. A normal probability
plot suggests the data could come from a population that is normally distributed. A boxplot indicates
there are no outliers. Complete parts a) through d) below.
5.05
5.72
4.62
4.80
5.02
4.59
4.74
5.19
5.29
4.76
4.56
5.71
Click the icon to view the table of critical t-values.
(a) Determine a point estimate for the population mean.
A point estimate for the population mean is
(Round to two decimal places as needed.)
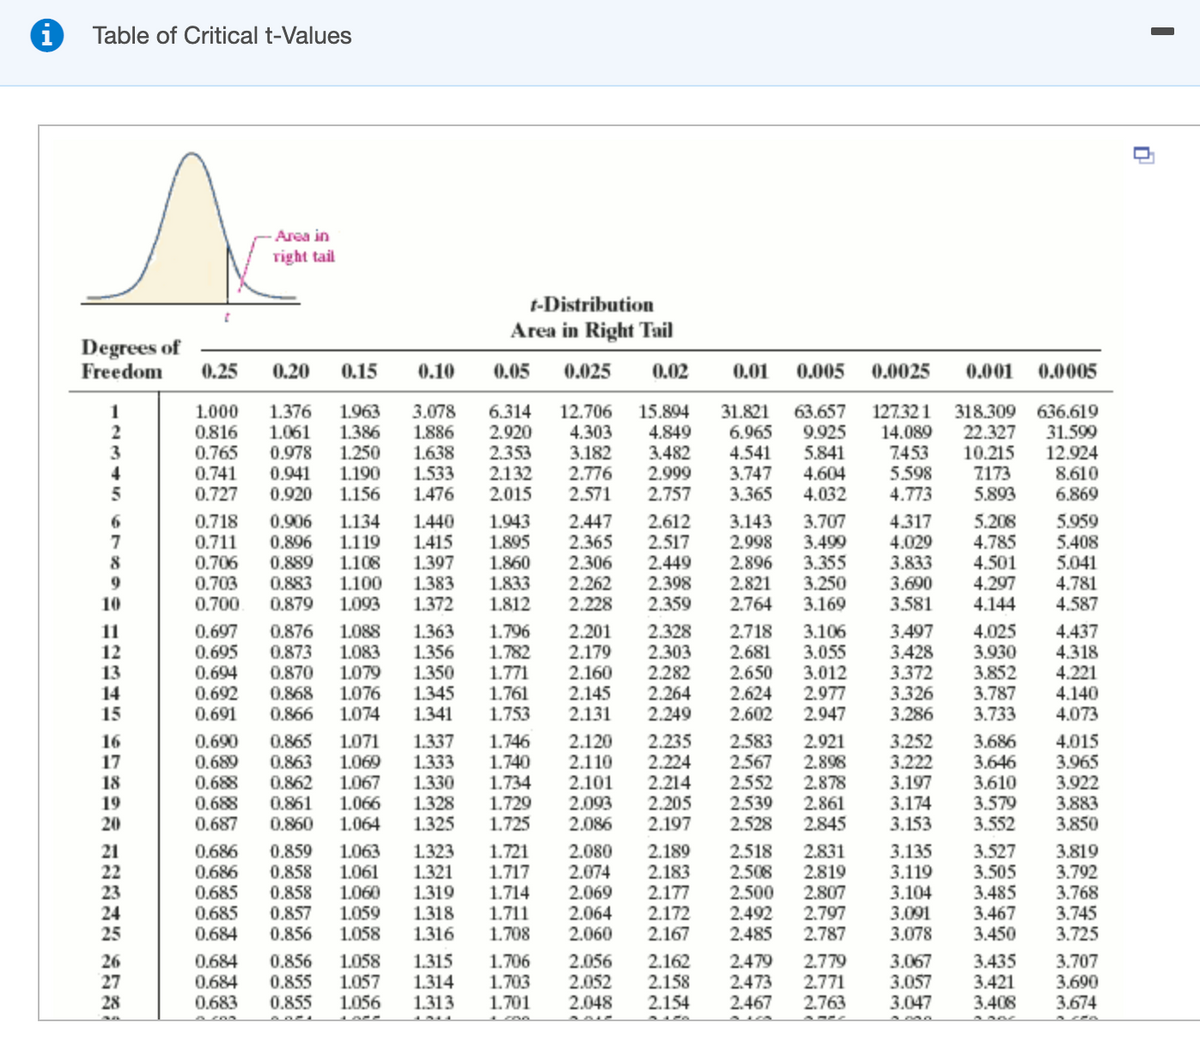
Transcribed Image Text:Table of Critical t-Values
Area in
right tail
t-Distribution
Area in Right Tail
Degrees of
Freedom
0.25
0.20
0.15
0.10
0.05
0.025
0.02
0.01
0.005 0.0025
0.001 0.0005
1.376
1.061
0.978
0.941
0.920
12.706
4.303
3.182
2.776
2.571
63.657
9.925
5.841
4.604
4.032
127.32 1
14.089
7.453
1
1.000
0.816
0.765
1.963
1.386
1.250
3.078
1.886
1.638
1.533
1.476
6.314
2.920
2.353
2.132
2.015
15.894
4.849
3.482
2.999
2.757
31.821
6.965
318.309 636.619
22.327
10.215
7173
5.893
31.599
12.924
8.610
6.869
3
4
4.541
3.747
0.741
0.727
1.190
1.156
5.598
4.773
3.365
0.906
1.943
1.895
1.860
1.833
1.812
2.447
2.365
2.306
2.262
2.228
3.143
2.998
2.896
2.821
2.764
3.707
3.499
3.355
3.250
3.169
5.959
5.408
5.041
1.134
0.718
0.711
0.706
0.703
0.700
1.440
1.415
1.397
5.208
4.785
4.501
4.297
2.612
2.517
4.317
4.029
3.833
3.690
3.581
7
8
0.896
0.889
0.883
0.879
1.119
1.108
1.100
1.093
2.449
2.398
2.359
1.383
4.781
4.587
10
1.372
4.144
0.876
0.873
0.870
0.868
0.866
1.363
1.356
1.350
1.345
0.697
0.695
2.201
2.179
2.160
2.328
11
12
13
14
15
0.694
0.692
0.691
1.088
1.083
1.079
1.076
1.074
1.796
1.782
1.771
1.761
2.303
2.282
2.264
2.249
2.718
2.681
2.650
2.624
2.602
3.106
3.055
3.012
2.977
2.947
3.497
3.428
3.372
3.326
3.286
4.025
3.930
3.852
3.787
3.733
4.437
4.318
4.221
4.140
4.073
2.145
2.131
1.341
1.753
0.690
0.689
0.688
0.688
0.687
0.865
0.863
0.862
0.861
0.860
2.583
2.567
2.552
2.539
2.528
3.686
3.646
3.610
1.071
2.235
2.224
2.214
2.205
2.197
2.921
3.252
16
17
18
19
20
1.069
1.067
1.066
1.064
1.337
1.333
1.330
1.328
1.325
1.746
1.740
1.734
2.120
2.110
2.101
2.093
2.086
2.898
2.878
2.861
2.845
3.222
3.197
3.174
3.153
4.015
3.965
3.922
3.883
3.850
1.729
1.725
3.579
3.552
0.686
0.686
0.685
0.685
0.684
2.831
2.819
2.807
2.797
1.063
1.061
2.080
2.074
21
22
23
24
25
0.859
0.858
0.858
0.857
0.856
1.323
1.321
1.319
1.318
1.316
2.189
2.183
2.177
2.172
2.167
2.518
2.508
2.500
2.492
2.485
1.721
3.135
3.119
3.104
3.091
3.078
3.527
3.505
3.485
3.467
3.450
3.819
3.792
3.768
3.745
3.725
1.717
1.060
1.059
1.058
1.714
1.711
1.708
2.069
2.064
2.060
2.787
26
27
28
0.684
0.684
0.683
0.856
0.855
0.855
1.058
1.057
1.056
1.315
1.314
1.313
1.706
1.703
2.056
2.052
2.048
2.162
2.158
2.154
2.479
2.473
2.467
2.779
2.771
2.763
3.067
3.057
3.435
3.421
3.707
3.690
3.674
1.701
3.047
3.408
Expert Solution
This question has been solved!
Explore an expertly crafted, step-by-step solution for a thorough understanding of key concepts.

Step by step
Solved in 2 steps

Knowledge Booster


Learn more about
Need a deep-dive on the concept behind this application? Look no further. Learn more about this topic, statistics and related others by exploring similar questions and additional content below.Recommended textbooks for you
Glencoe Algebra 1, Student Edition, 9780079039897…
Algebra
ISBN:
9780079039897
Author:
Carter
Publisher:
McGraw Hill
Glencoe Algebra 1, Student Edition, 9780079039897…
Algebra
ISBN:
9780079039897
Author:
Carter
Publisher:
McGraw Hill